
“Is the market high only because of some irrational exuberance – wishful thinking on the part of investors that blinds us to the truth of our situation?” –Robert J. Shiller, Irrational Exuberance (2000)
The quote above is the main question approached in Dr. Robert J. Shiller’s masterwork Irrational Exuberance. The book, written at the peak of the dot-com bubble, theorized that investors were ascribing far too much value to companies that, in many cases, made nothing and had no revenues.
Dr. Shiller is a brilliant man and economist. You do not get a Nobel Prize unless that is true. And in the case of the dot-com bubble – he was absolutely correct as investors learned just months later.
While we have not agreed with Dr. Schiller on everything (for example, his measurement of stock market valuation was bearish 416 of 422 months from 1981 – 2015), his warning against irrationality is important and it cuts both ways. We must be neither irrationally exuberant nor irrationally pessimistic. In a strange way we have seen both this year. The irrational pessimism around the market and economy lead to the quickest bear market correction in more than 75 years. Likewise, the irrational exuberance of the big tech names led the market to all-time highs during a year when we will likely see the largest GDP contraction in nearly as long.
Our job – and by “our” we mean both Insight Wealth Group and our clients – is to be willing to let data and reason temper our irrationality. We can never get too high or too low. Last week’s memo – on the impact of the Presidential race on the stock market – is one of those topics that can certainly drive emotion into decision making. This week we are going to take a step back as the 3rd Quarter ends and look at the fundamental state of the economy. While elections and COVID cases and Supreme Court fights can swing the market from day-to-day, it is the economy that will drive the market over the long term.
All Quarters Are Not Created Equal
We wrote a similar memo at the end of the 2nd Quarter where we suggested that the stock market’s performance in July would be predicated almost entirely on the economy’s ability to “beat” expectations. That turned out to be true as the real impact of the Coronavirus, while bad, was not nearly as catastrophic as many experts projected.
Sadly, it is not going to be that easy coming out of Q3. The election weighs too heavily on the market’s mind today. For more on that, we would encourage you to see last week’s memo here.
While this election is fraught with emotions, we must remember we have been through this before. Policy changes coming out of the election (or continuation of policies) will have an impact. But who the President is on January 21, 2021 is not going to change our levels of production or consumption. The economy will still be the economy when we wake up the day after Election Day. So, while we are preparing for every outcome, and will have our strategic game plan in place, it will not change our fundamental outlook on the economy.
Focus on What We Know
So, as we have done in memos past, we are going to focus on what we know and walk you through some statistics that we are paying close attention to today. We will get up-to-date information throughout the month as we hit our normal quarterly reporting dates for key economic data. We will work to keep you up to speed as that information comes to us as well.
Global Economic Growth
While we saw a quick recovery in Q2 of things like consumer spending in the United States, we must remember that we live in an inextricably connected global economy. As much as we would like to focus our attention entirely on what is happening here at home, what is happening abroad has a direct impact on our market and economy.
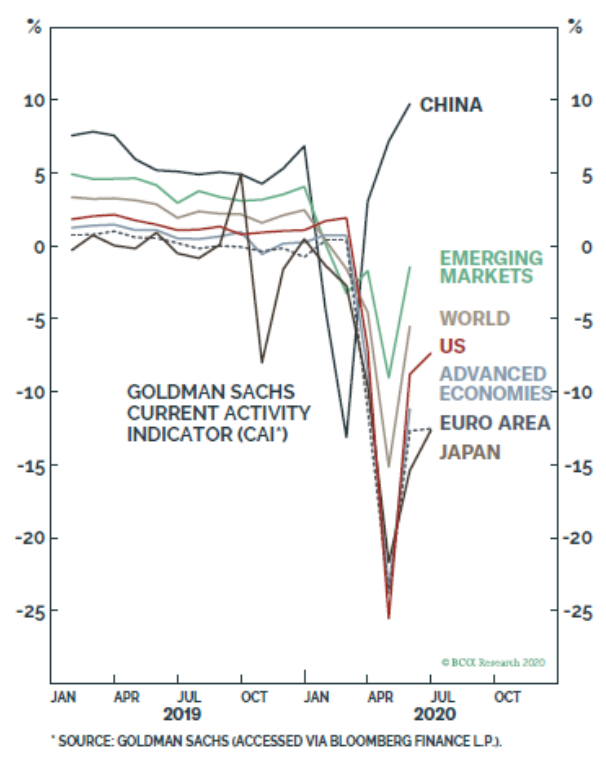
The news globally is…pretty good. We are starting to see economic growth pick up around the world in the post shutdown world.
Past performance is not indicative of future results
While the notable overperformer is China, we are seeing a similar reaction across the world. As you know, we take a cautionary approach to Chinese economic data as it is hard to trust. But the overwhelming signs are positive.
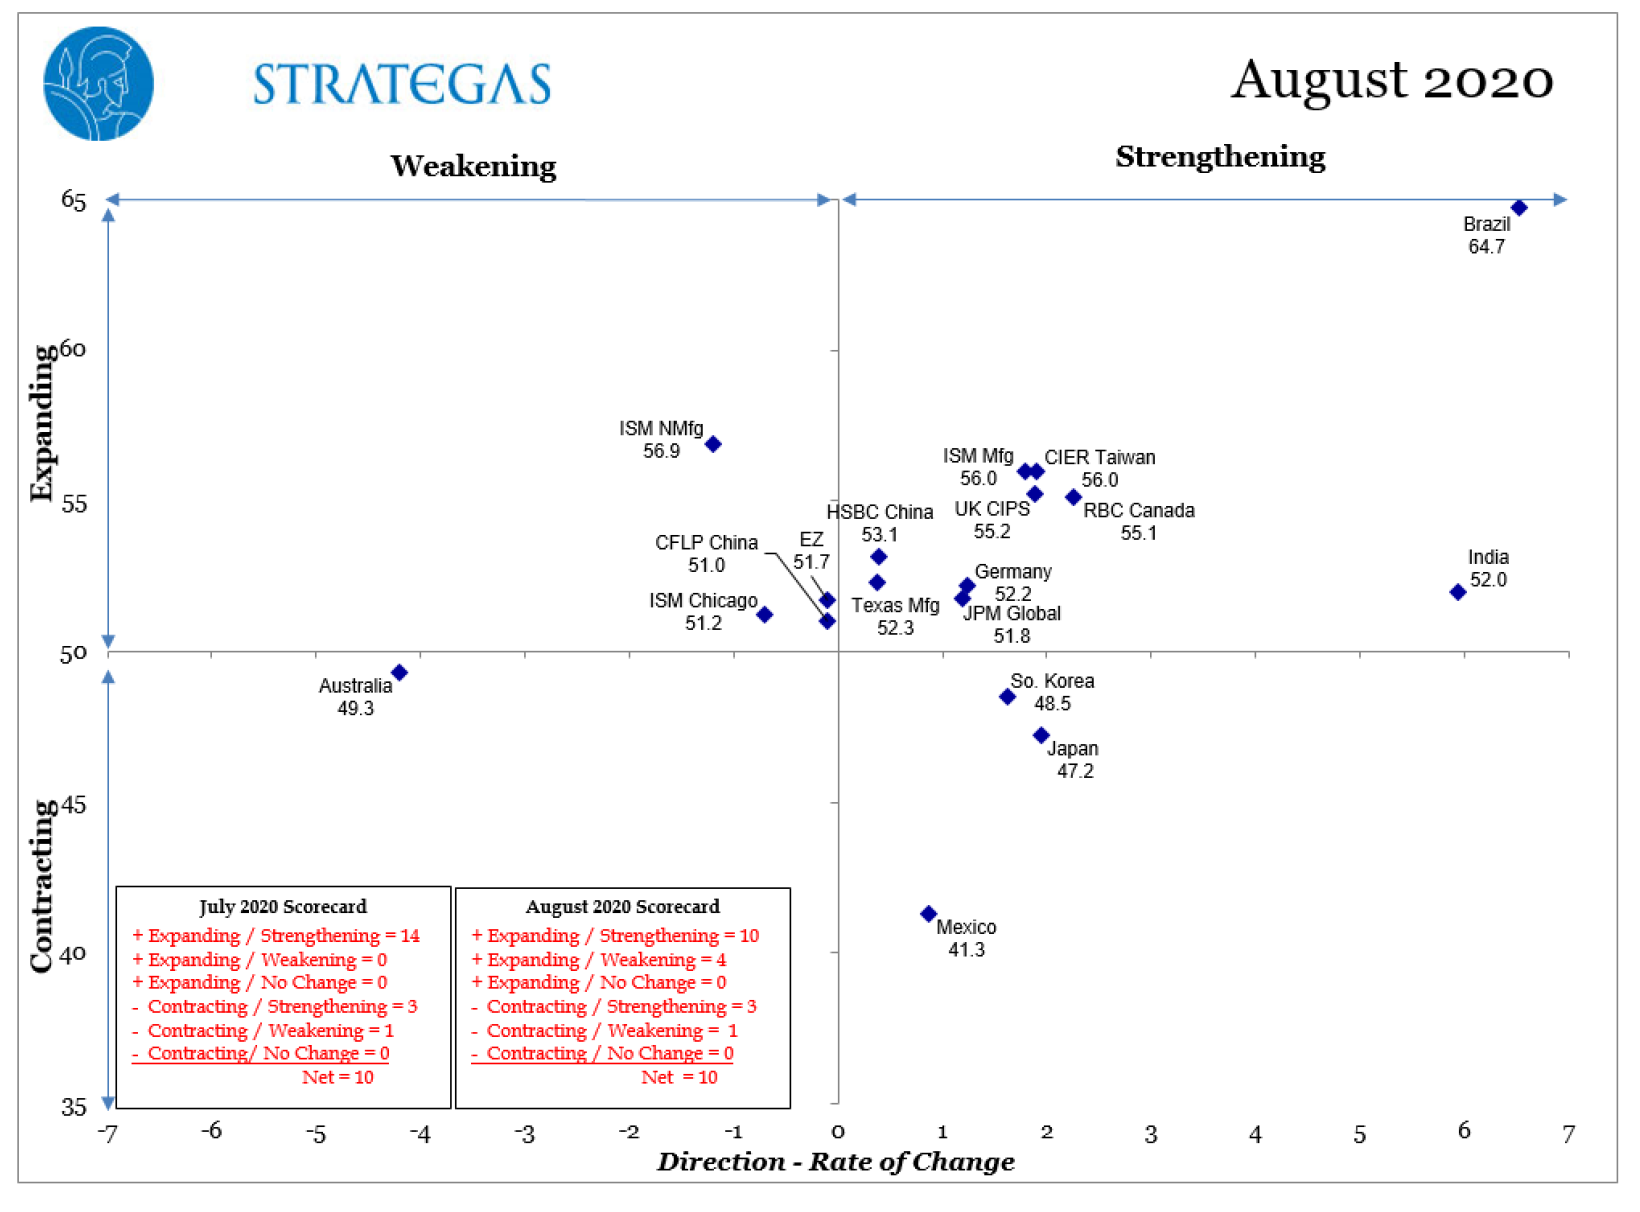
The chart below is one we look at every month in our Investment Committee meetings. It needs a little explanation (and it is a little tough to read!), but we think you will understand its importance. This chart is measuring two variables: 1. Is a country’s economy growing or shrinking?; and 2) Is its rate of change accelerating or slowing?
Any country above the horizontal axis has an expanding economy. As you can see most measured economies are above this level (that’s good). Additionally, any country showing to the right of the vertical axis has an accelerating rate of change. Thus, we want to see most measured economies in the upper right quadrant of the chart which is exactly what we are seeing today.
Past performance is not indicative of future results
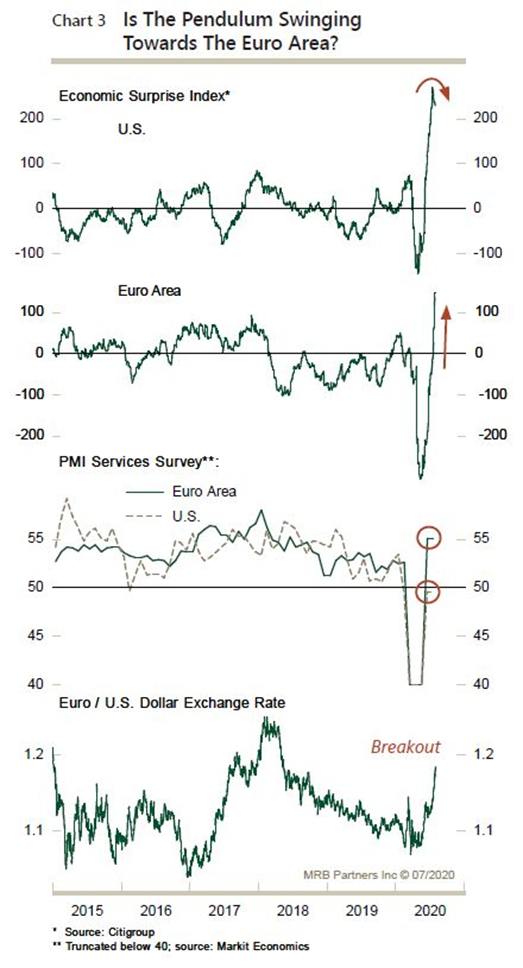
All these non-U.S. countries also have something in common: they do not have a contentious election in the next 40 days. For some time now, the U.S. stock market has led the way out of the recovery. That began to change in September as Europe significantly outperformed U.S. equities in the month. The EuroStoxx 50 and Euro Stoxx 600 are down 1.79% and 1.08% respectively while the S&P 500 was down 5.77% through Friday. That is one of the main reasons we have maintained our overweight position to developed European countries in our equity allocations.
Past performance is not indicative of future results
Unemployment
We have talked in past memos about the strong support provided by Congress for the unemployed in the first several months of the COVID economy. While those checks have run out (and there is little development on a new funding bill), we still have significantly high unemployment.
We will get the September unemployment number on Friday. The expectation today is the economy will have created 850,000 jobs and the unemployment rate will have dropped slightly from 8.4% to 8.2%.
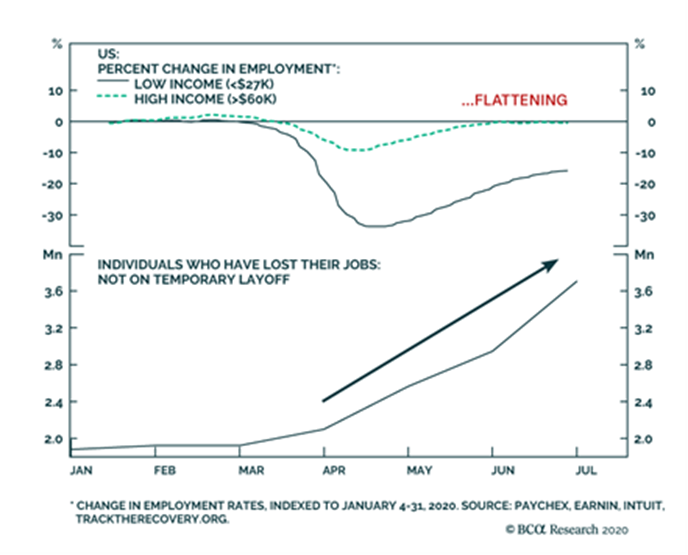
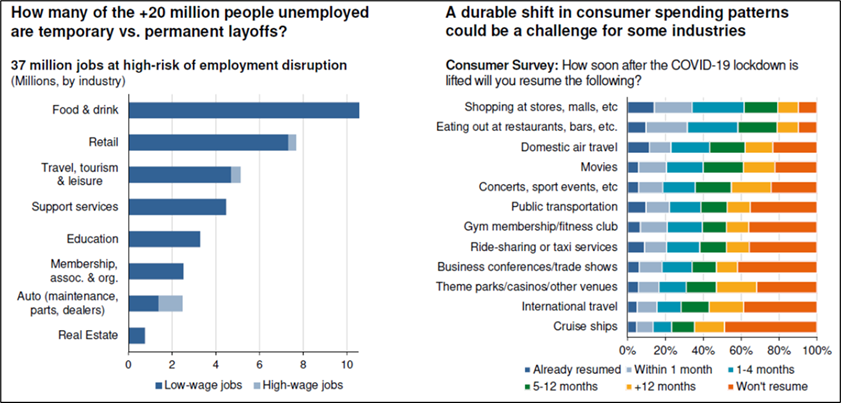
It is important to note, however, who this high level of unemployment is impacting. We are seeing two important things. First, those with higher income (greater than $60,000/year) have essentially gotten back to pre-COVID levels. The news is not nearly as good for those with low income jobs. While the employment numbers have improved, they still have a long way to go. And, more importantly, more and more are reporting that their unemployment is not due to a temporary layoff. They have permanently lost their job.
Past performance is not indicative of future results
That situation will not be resolved until people become more comfortable with living their pre-COVID lives. And that will not likely happen until we have a vaccine widely available.
Past performance is not indicative of future results
Consumer Confidence and Retail Sales
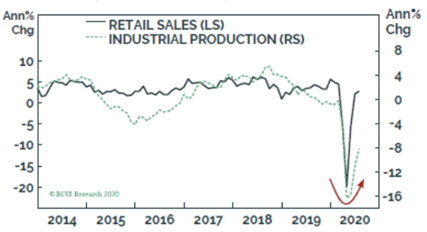
As you have heard us say many, many times, the U.S. consumer is the key driving force behind our economic success. When consumers are spending money, growth occurs. And, right now, they are spending money. Retail sales are back to their pre-COVID numbers.
Past performance is not indicative of future results
While the expectations for both consumer confidence and retail sales for September are that they’ve improved (we’ll know the consumer confidence figure tomorrow), we have to remember that the ability to spend money has been linked directly to the large amounts of stimulus that have been pumped into the economy. As we go back to traditional unemployment benefits, those lower income workers are only seeing roughly 50% of their income replaced. That is a political issue and it is hard to say when/if it will be resolved. It may serve as an anchor around consumer spending.
GDP Update
The last bit of economic news pre-election will be the Q3 GDP report. To be fair, we do not think there is a lot of value in this report in volatile times like these. Much like there was no question the news was ugly in Q2, the news in Q3 will undoubtedly be very good. The Atlanta FedNow projection is for 32% GDP growth in Q3 (after a 35% contraction in Q2). We are more concerned about the long-term trend which we really will not have a sense of until the end of the year or early 2021.
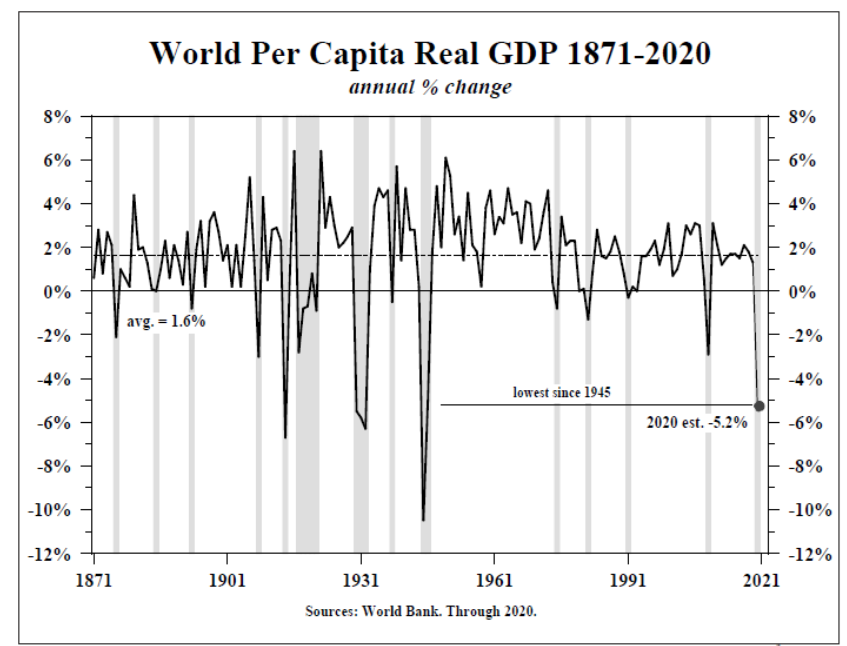
Right now, we are still expecting a roughly 5% GDP contraction for the full fiscal year. As you can see from the chart below, that would be the worst contraction since the recession that happened at the conclusion of World War II.
Past performance is not indicative of future results
But that is still much, much better than some of the horrible expectations we were hearing in March and April. We will take 5.2% over 25% any day of the week.
Still Work to Do
While we’ll know a lot more once we see the data, our general thesis is this: things aren’t nearly as bad as we were told they would be (they never are), and aren’t nearly as good as they should be. The economy is improving, and the fundamentals today are generally strong. But there is much work to be done. Sadly, there is no economic figure that could surprise to the good so much as to pull attention away from the Election. Just remember that, once we know who our next President will be, the economy is still going to matter.
Sincerely,