
The Weekly Insight Podcast – What if the “Consensus” Is Wrong?
Before we dive into this week’s memo, we wanted to provide a brief update on communicating with our office. As you all know, the world has changed dramatically over the last few decades as communication has become easier and easier. What used to be letters in the mail has now turned into emails and blog posts and Twitter feeds and podcasts.
With that ease of communication also comes the need to properly manage the flows of information to ensure they’re being handled – at least in our industry – in a compliant manner. As such, we wanted to inform you of a new tool we’re utilizing and a new way to contact our staff.
We know that some clients may prefer to utilize texting to reach your advisor or their teams. In an effort to remain compliant with SEC and FINRA rules for the retention of communication, we have implemented a new system called “MyRepChat” which will allow you to text your team directly – and them to you – while remaining compliant.
That does, however, mean we need you to update the phone numbers you use to communicate with our team. If you would like to text us, please utilize the numbers below. Additionally – you can also call us on these numbers, and it will go directly to our phones. We hope you find this tool useful!
MyRepChat Numbers
- Kristen Crouthamel: (515) 969-1869
- Andrew Dorr: (515) 750-2010
- Erin Kinman: (515) 969-1890
- Andrew Kleis: (515) 478-3558
- Ben Morrow: (515) 969-1993
- Alex Perez: (515) 236-2927
- Martina Valline: (515) 209-2029
If you have any questions about this new system, please don’t hesitate to give us a call at the office at (515) 273-1333.
Now let’s get down to business.
Inflation Update
Wait…we’re back on inflation? Weren’t we done with that? Sort of. Comments from Chairman Powell last month led investors to believe the days of worrying about inflation were behind us. And that’s not necessarily wrong. But that doesn’t mean a bad inflation report or two can’t change the direction of the economy.
Last week we got both the CPI (Consumers) and PPI (Producers) data for December. The data wasn’t bad – in fact, the PPI data was pretty good. It just wasn’t good…enough… to justify the market’s confidence in upcoming rate cuts.
Core CPI (the measurement which excludes food and fuel) came in at 0.3% month-over-month (the same as November) and dropped from 4.0% to 3.9% year-over-year. That was slightly worse than the expectation of 3.8%. All Items CPI also came in at 0.3% month-over-month, but that was higher than November’s 0.1%. And the year-over-year number actually rose from 3.1% to 3.4%.
The big driver in All-Items was energy. In November, energy prices fell 2.3%, but in December they rose 0.4%. That’s a big swing and drove the change.
But it’s the Core data we’re most concerned about. And it’s the same busted data set that is causing problems. As you’ll recall from previous memos early last year, we were concerned about the way the Bureau of Labor Statistics (who calculates inflation) was measuring inflation in shelter costs. And – yet again – the problem raises its ugly head. According to the BLS, shelter costs grew by 0.5% in December and 6.2% for the full year.
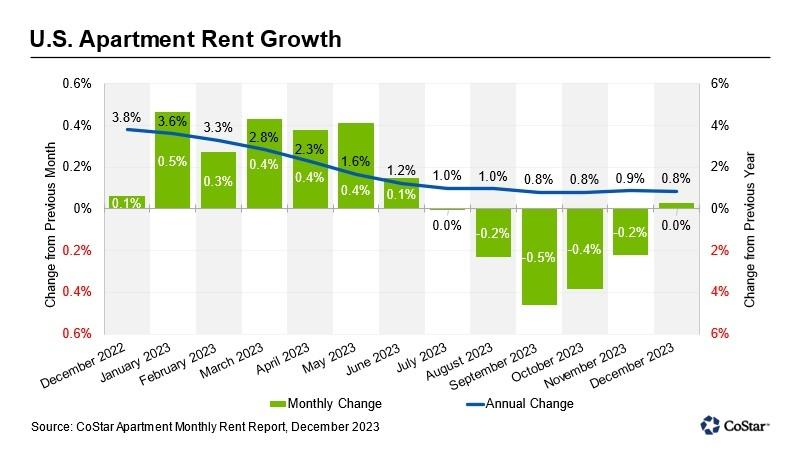
But is that real? Nope. It wasn’t last year, and it isn’t this year. All we have to do is look at the data provided by the companies that are actually tracking shelter prices. Apartments.com is showing us that rental increases in 2023 were 0.8%.
Past performance is not indicative of future results.
Zillow’s rental data is a bit more aggressive. It shows a growth of 3.33%.

Source: Zillow.com
Past performance is not indicative of future results.
And according to Zillow, the largest repository of home sale data in the United States, the price to purchase a home rose 2.64%.
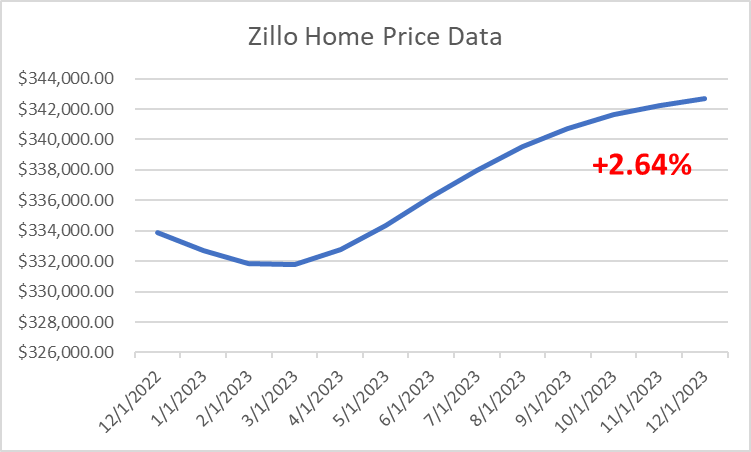
Source: Zillow.com
Past performance is not indicative of future results.
Let’s use the worst of these three numbers – Zillow’s 3.33% increase in rental rates – and look at what it means for inflation. We know that the two big categories for the shelter compilation are “rent of a primary residence” which makes up 7.528% of the CPI calculation and “Owners’ equivalent rent of residence” which makes up 25.424% of the CPI Calculation. That adds up to 32.95% of CPI. What happens to CPI if we drop that number from 6.2% to 3.3%? All Items CPI for 2023 would have been…2.10%!
The Market Reaction
So how did the market react to this data? Not well at first! The market was down over 1% on Thursday morning right after the news came out. But by the end of the day Friday, it closed slightly ahead of where it was on Wednesday night before we got the CPI data.

Past performance is not indicative of future results.
As we’ve talked about since the Fed meeting in December, much of the market’s success this year is going to be built on the idea of the Fed cutting rates. So, what did this news do to those expectations? Surprisingly, they got more aggressive! Prior to Thursday’s data, the market was predicting rate cuts would begin in March and we would get six rate cuts in 2024. Now? March is still the start, but the market is pricing in seven rate cuts.

Source: CME Group
Past performance is not indicative of future results.
This chart shows fully 81% odds of a cut in March. That’s up from the mid-60% range early last week. That’s a significant shift.
The market is saying the inflation data we got this week was more than enough to continue the “cuts are coming” rhetoric. And we agree. Cuts are coming. But there’s also a big divergence between what the market is pricing in and what members of the Federal Reserve are saying.
New York Fed President John Williams said this week:
“Before we dial back on the restrictive stance of policy, I think it’s important that we’re confident we’re moving toward 2% (inflation)”.
Cleveland Fed President Loretta Mester agrees stating about rate cuts in March:
“It’s probably too early”.
And Richmond Fed President Thomas Barkin indicated he was looking to see if the reduction in inflation was “broader based” before he was willing to support any cuts.
History would tell us the probability chart above is significantly more accurate as a predictive tool than the Fed’s “Dot Plot”. But even the chart above is rarely accurate. Just last year the probability in January was that rate cuts would start in the second half of 2023. That certainly didn’t happen!
The good news here is that everyone – including the members of the Fed – believes rate cuts will happen this year. But we’d caution you that the market’s optimistic view may set us up for a bit of disappointment. If we get to the Fed meetings in March or May and there isn’t any traction to rate cuts, we’d expect some volatility in the markets as money managers must rethink their expectations. But that volatility should be short-lived as it’s clear the cuts are coming.
Sincerely,