
The Weekly Insight Podcast – A Slow Start
Oh no! The first week of trading in the S&P 500 is behind us and 2024 is off to a rough start! The S&P 500 is down 1.52%. Clearly that portends something horrible, right?
Nope. Let’s get this out of the way quickly. We went back and looked at the first week of trading for the last 15 years and there is nearly zero correlation between how the year starts and how the year ends. There have been five times the first week of trading was negative. In two of those times – 2022 and 2015 – the S&P was down for the year (-19.44% in 2022 and -0.73% in 2015). The other three years – 2016, 2014, and 2009 – the market was up strongly (9.54%, 11.39% and 23.45% respectively).
A slow start can be just that… a slow start. It is if more data of impending doom starts to line up that we should be concerned. So, let’s go through the data sets that we’re looking at this week to see if we should be more concerned.
Earnings
Earnings season is upon us. This week will start a two-week period where the financials – including the big banks – kick things off. And, not surprisingly given what has happened to interest rates, the big banks are expected to be a bit of a drag on earnings.
But before we get to our expectations for Q4, it’s important to look back at what we were saying about expectations a year ago. In our first memo of 2023, we noted that the market was expecting calendar year earnings to grow from $220.87 to $231.59 in the S&P500. That would have been growth of 4.85%. You can see that data here.
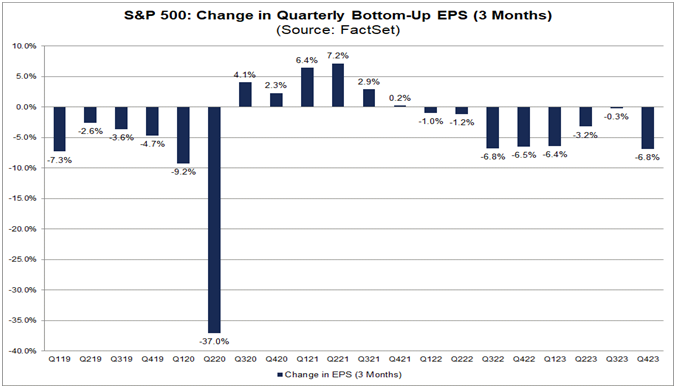
We don’t yet know what Q4 2023 is going to give us, but you’ll recall us discussing many times in the past how analysts get significantly more pessimistic prior to the release of earnings. That’s certainly happening right now. Analysts have revised their expectations for Q4 down 6.8%, which tied for the most we’ve seen since 2020.
Past performance is not indicative of future results.
This would leave earnings growth for Q4 at +1.30% and result in an anemic CY 2023 earnings growth of 0.80%. History would tell us we’ll exceed those numbers. But we’re not climbing the ladder all the way up to 4.85% which was expected a year ago.
But what’s more interesting is the expectations for 2024. While the Q42023 revisions were significant, the CY2024 revisions were not. They declined by just 1.3% and, given the estimates for CY 2023, we’re now expecting earnings growth of 11.44% in 2024.

Past performance is not indicative of future results.
If that’s true, 2024 would produce the fourth best earnings growth we’ve seen in the last 11 years, behind just a COVID inflated 2021 (+48.43%), and 2017 (11.90%) and 2018 (20.92%).
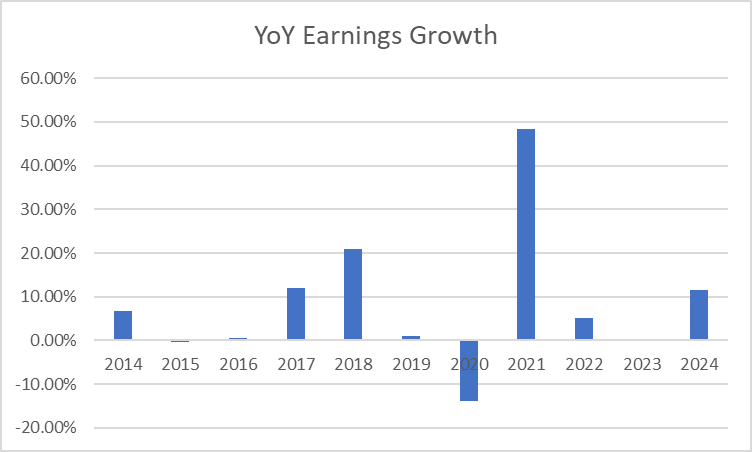
Source: FactSet
More importantly, this is happening at a time when the forward price-to-earnings (P/E) ratio of the S&P is significantly lower than during those previous times. Today the forward P/E of the S&P 500 is 19.2x earnings. That’s still above the 5- & 10-year averages (18.9x and 17.6x respectively). But on December 31st of 2016, 2017 and 2018, the forward P/E was 24.14x, 24.54x, and 39.90x. That means the market is much more fairly valued with significant growth in earnings expected. Not a bad place to be.
Economic Data
At the same time, we’re trying to digest expectations in earnings, there is a lot of end of year data being thrown at us on the economy. And we’re still not seeing the “impending doom” of a recession that forecasters have been predicting for the last 24 months.
We got December jobs data last week. The economy created a robust 216,000 new jobs in December and a total of 2.7 million jobs in 2023. That puts total employment at 157.2 million jobs, which is an all-time record and more than five million jobs higher than the pre-pandemic peak.

Source: St. Louis Federal Reserve (FRED)
At the same time, wage growth continues to stabilize, reducing one of our biggest inflationary risks. We’d still like to see it come down further, but 4.10% growth is much better than the nearly 6% we were seeing just 20 months ago.
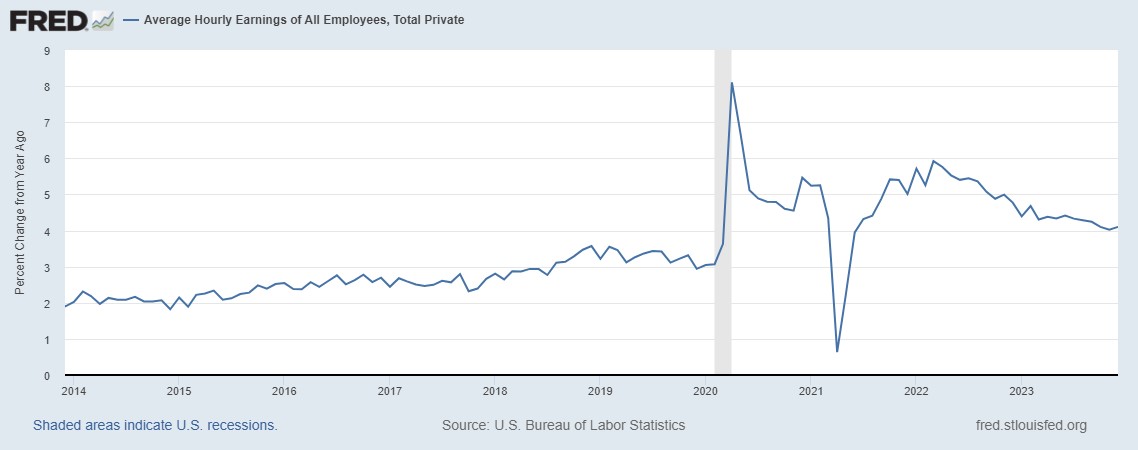
Source: St. Louis Federal Reserve (FRED)
And all of this is happening at a time when GDP growth is continually surprising to the upside. We’ve discussed the Atlanta Fed’s GDPNow data before. It continually shows out as the best predictor of current quarter GDP growth. Their current estimate of 2.5% growth for Q4 is 2.5x the “consensus” estimate. Much like it was last quarter…and the quarter before that…and the quarter before that… Maybe someday someone will include their estimate in the “consensus”.
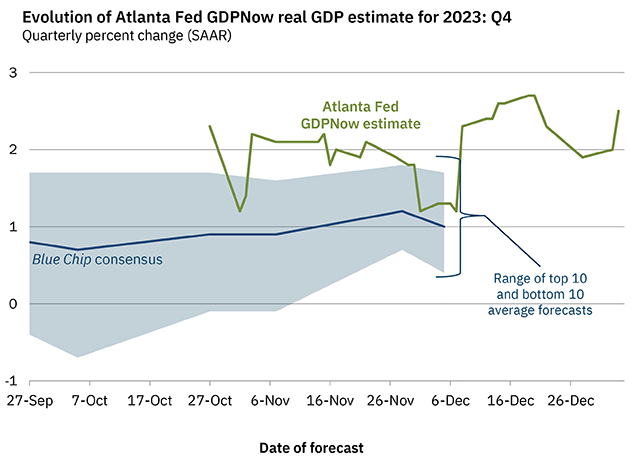
Source: AtlantaFed.org
So that brings us back to where we started. It was a rough week in the market. That happens. In fact, much worse happens very, very regularly. Historically we see over seven 3% corrections in the market every year. We see over three 5% corrections every year. In fact, we see one 10% correction – on average – every year!
So, we shouldn’t let a bad week after an exceptionally good run distract us from the fundamentals of this market and economy. (At least for the next three weeks before Chairman Powell steps back to the podium…)
Sincerely,