The Weekly Insight Podcast – We Love Markets in Turmoil
Summer is here – in practice if not technically. Kids are out of school; summer vacations are beginning. The world just feels a little different this time of year. People tend to focus a little less on their finances over the summer and a little more on the things most important to them.
The result is that the market tends to take a breather over the summer. Most returns tend to happen at the start of the year and the end of the year, and the summer tends to be…uneventful.
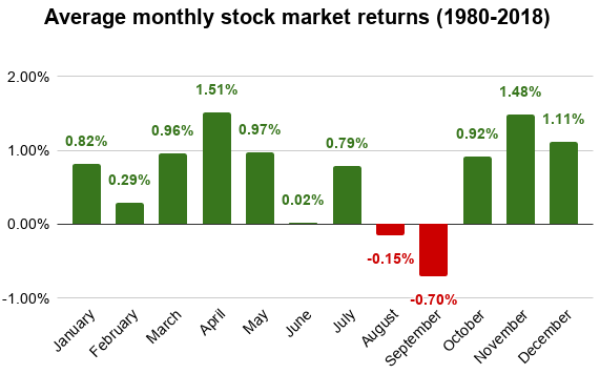
Past performance is not indicative of future results
Given the year we’ve had so far, uneventful might be a blessing! But is that really what we’re marching towards? Or should we expect a little more activity this summer? And will that activity be positive, or more of what we’ve experienced over the last several months? Let’s dive in and take a look.
Historically Bad Start to the Year
There is no one reading this memo that is going to be surprised when we say it’s been a rough start to the year. But what if we told you it was one of the worst starts to the year in history? It was. In fact, through April, it was the third worst start to a trading year in the S&P 500’s history, with the market down 13.31%. Then came a very volatile May, but at the end of May the market was down 13.30% – essentially unchanged.
We tend to focus a bit too much on the calendar, however. We don’t care one way or another when a downturn happens. If it happens at the end of the year, the beginning of the year, or the middle means nothing to us. We do care, however, how significant the downturn is.
The truth is the market turns south at some point nearly every year. Some downturns are worse than others. Despite all the scary news, we can see that the downturn through the end of May was on par with “average” historically. Not as scary as some would like you to believe.
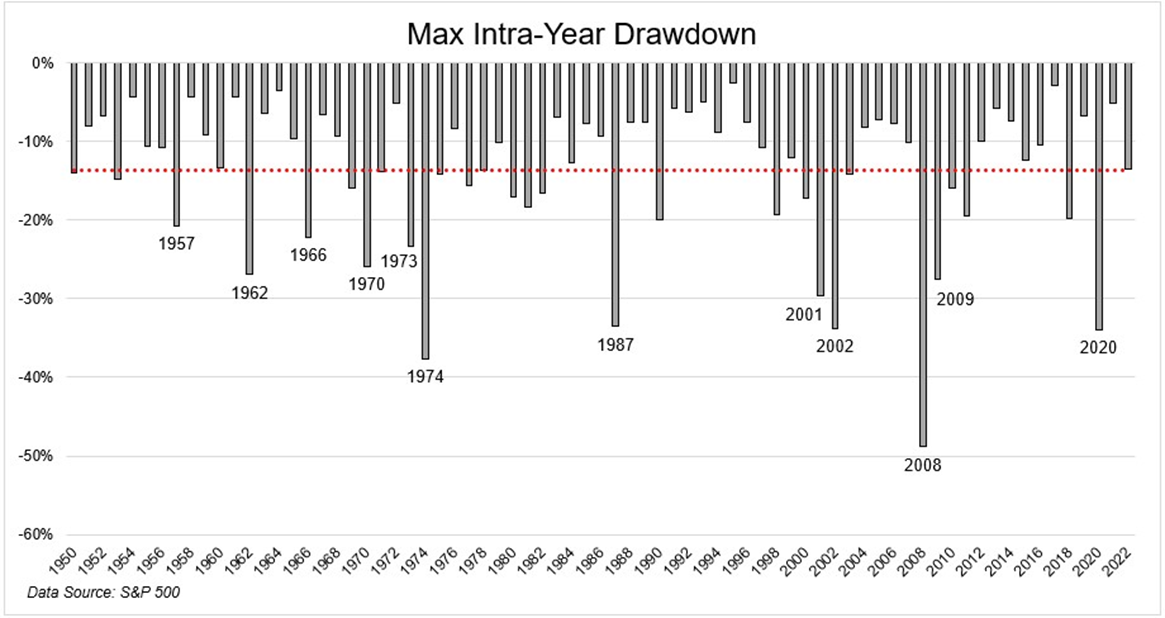
Past performance is not indicative of future results
But, for the sake of the frantic media, let’s play the calendar game. Remember we told you this was the third worst start to the year of all time. What happened in the market after previous bad starts to the year? The median return for the rest of the year was positive 12.9%.
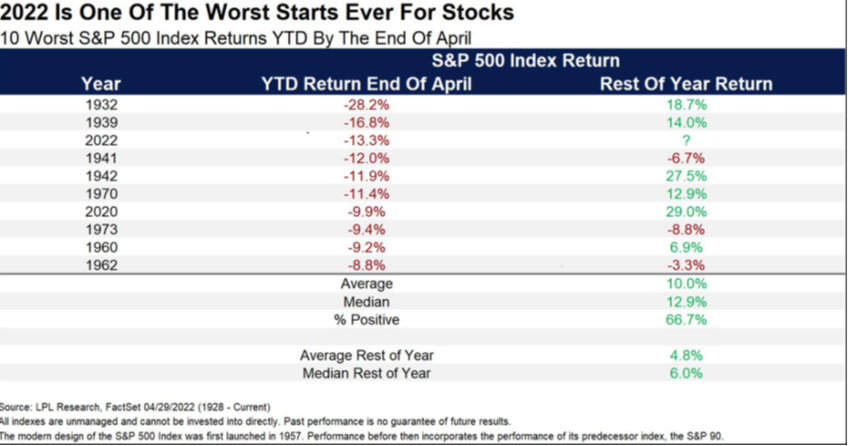
Past performance is not indicative of future results
But Does History Even Matter?
In the end, what’s happened in past cycles is informative, but won’t guarantee outcomes. As they say, history doesn’t repeat itself, but it often rhymes. History won’t determine what happens with the market this summer, inflation, the Fed, and economic data will.
If you read the headlines right now, there isn’t a lot of good news on that front. After the Biden/Powell summit on inflation last week we saw headlines like “Inflation Spiraling,” “Yellen Admits She Was Wrong on Inflation,” etc., etc. The problem is those headlines are – in our opinion – about three months too late!
Yes, inflation is remarkably high. We all know that. Yes, it is putting the squeeze on pocketbooks. But as we’ve said in these pages for several months now, those pocketbooks are fatter today than they have been in a generation. And inflation? If it hasn’t already peaked (in March), it’s peaking right now. The three big core inflation issues – cars, shelter, and durable goods – have all begun coming back down the inflation ladder.
So that leaves us with the strength of the economy. If inflation is coming down, but the economy is weak, markets will suffer. But if the economy continues to be strong, we think there will be some opportunities for the back half of this year. And right now? The economy is showing some significant strength.

Just this week we saw the data on Consumer Confidence in the U.S. It came in at 106.4 (anything above 100 is good), well above the expectation of 103.9. We also saw the Manufacturing PMI data we’ve discussed in these pages before. In that data set, anything above 50 means it’s expanding. It came in at 56.1 which is a historically high number – and well above the 54.5 that was expected. Then there was non-manufacturing PMI (service sector) which came in at 55.9. All of these are signs of a strong economy. If we can maintain that – and see weakening inflation – watch out.
Finally, this brings us to our well-worn theme: Fear and Greed. We know we beat this into our readers all the time. But sometimes the data is just too good (or too funny) not to share. Which brings us to our favorite chart.
If you’re a regular watcher of CNBC (for your sake, we hope not!), you may recall that when things get particularly nasty in the market, they pre-empt their regular programming for “Markets in Turmoil” specials. We LOVE it when we see that pop up on our screens.
Why? See the chart below. It tracks the markets’ return one year after every “Markets in Turmoil” segment going back to 2010. The average return? +40%.
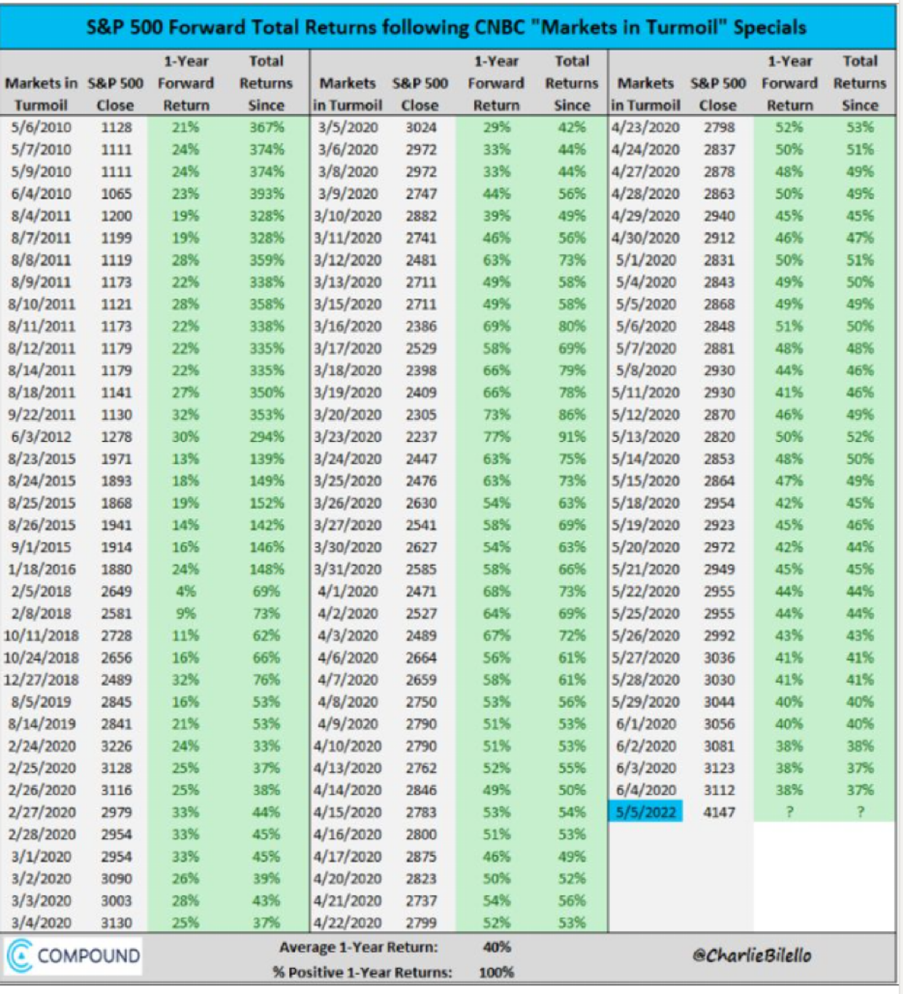
Past performance is not indicative of future results
Is this strong technical analysis? No. But it’s a great indicator of when the fear cycle begins to hit its peak. And they did the first one of this cycle last month. History tells us it may be a suitable time to be more optimistic than the media is suggesting.
Sincerely,