Editor’s Note: We’d encourage current Insight clients to read to the end of this week’s memo. There are some important year end housekeeping items to run through. Thanks!
Over the years, we’ve written a lot about volatility. Volatility comes in many shapes and fashions. There’s positive volatility (no one complains about that!) and negative volatility. There’s volatility caused by external issues (COVID) and there’s normal, technical volatility. In all its many forms, volatility is one of the key items that keep folks like us up at night. Trying to decipher what volatility means in the current environment is an important part of our job.
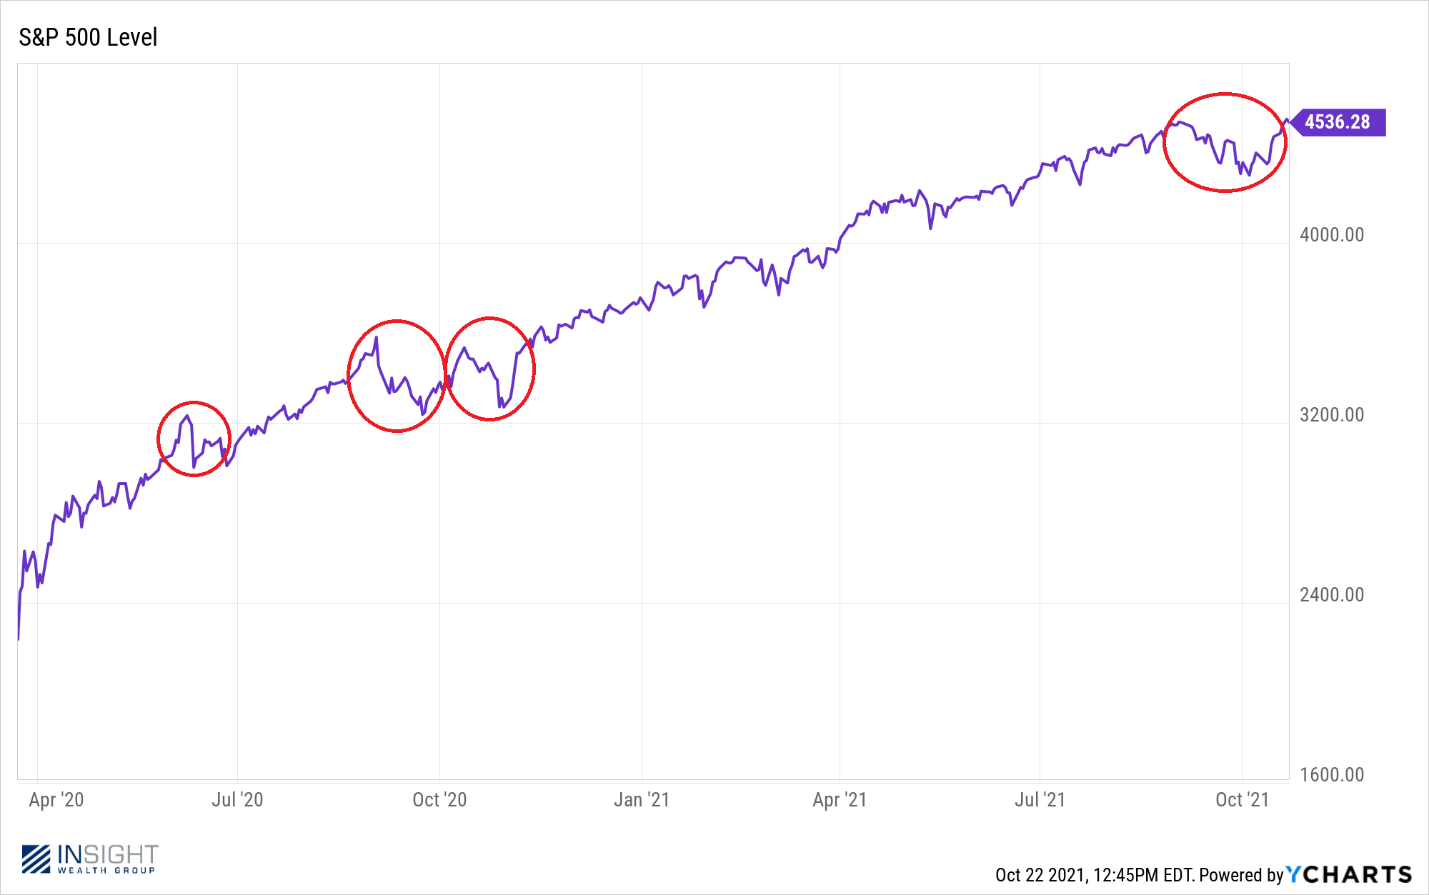
But, as with many things related to the market, the only way to truly understand it is to look back after it has happened. That’s why we remind our readers a lot about “normal” volatility in the market. What’s “normal”? To us it’s the fact that there are – on average – three 5% market corrections each year and one 10% correction roughly every 13 months.
By that standard, we’re missing “the big one” when it comes to normal corrections. As you’ll see from the chart below, in the last 19 months we’ve had four 5% corrections and zero 10% corrections. The “market” has moved at a fairly steady pace upwards.
Past performance is not indicative of future results.
There is, however, a very important distinction between “the market” and “stocks”. And this last correction – which lasted from early September to early October – was very interesting when you dive deeper. But, before we look under the hood, we need to do a quick refresher on how “indexes” work.
What is a Market Cap Weighted Index?
Nearly all the big indices – except for the Dow Jones Industrial Average – are “market cap weighted”. Simply put, this means the bigger the company in the index, the bigger piece of the index that company makes up.
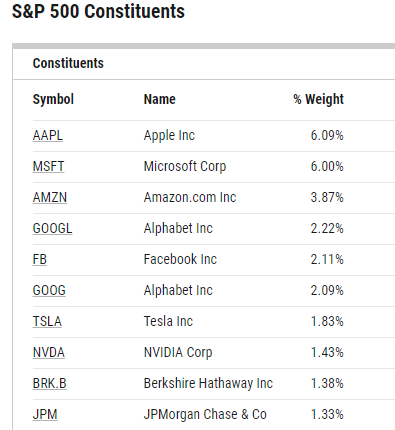
Let’s look at the S&P 500 as an example. In its current form, the top 10 names in the S&P 500 – the first eight of which are arguably tech companies – make up 28.35% of the index.
Source: YCharts
Past performance is not indicative of future results.
So, if you hold $1,000 worth of an S&P 500 ETF, $283.50 of your investment is in 10 names. Likewise, $409.60 is in the top 25 names and $540.60 is in the top 50 names. That means less than half of your investment – 45.94% – is in the bottom 450 names in the S&P 500. Not exactly a diversified position.
That type of allocation hides the larger picture of how individual stocks are actually performing. And when you look at last month, it wasn’t very pretty.
The Stealth Correction
So, we’ve established the market has been down 5% four times in the last 19 months. That’s fairly normal. But we’ve also established we’re well overdue for a larger correction. Except maybe that bigger correction has already happened.
Source: Strategas
Past performance is not indicative of future results.
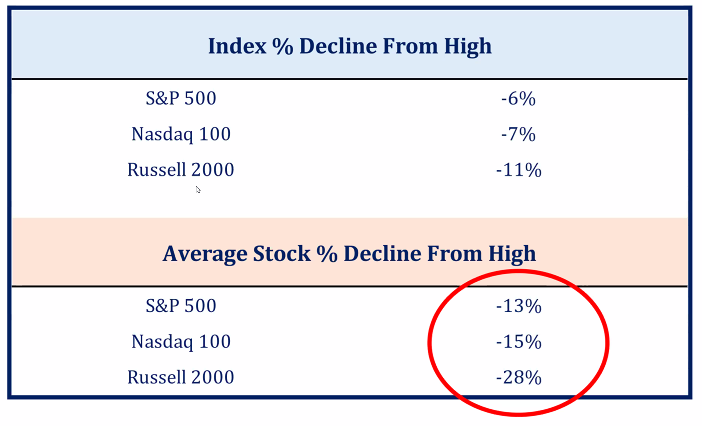
The data above – from the last 5% correction – shows that the average stock in the S&P was down 13% over that time period. If you widen that out to the Russell 2000 – the 2000 largest publicly traded U.S. companies – the average stock was down 28%. In one month! But no one is telling that story right now.
And while there didn’t seem to be panic on the streets, investors did take notice to some degree. As the chart below shows, investors started raising cash and institutional investors were as bearish as they’ve been for a long time.
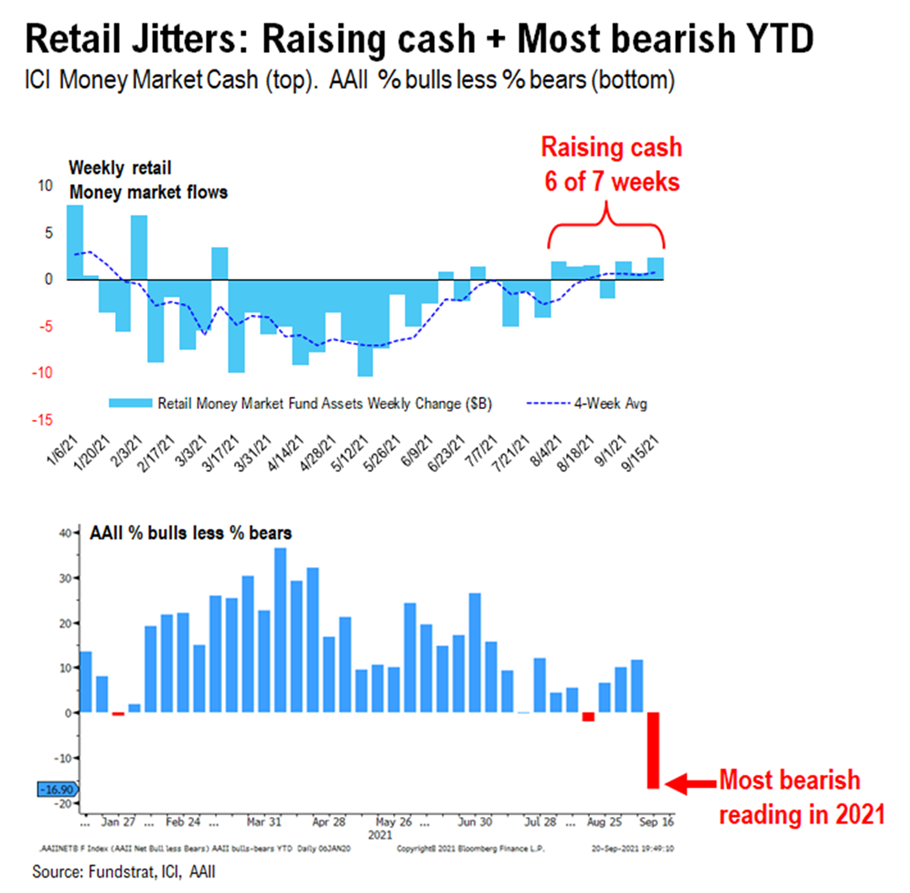
Past performance is not indicative of future results.
We know we can be repetitive in these pages, repeating the same tropes over and over again. But that’s usually because they’re important and fundamental to our philosophy. There has been no more repeated quote in these pages than Buffet’s “Be greedy when people are fearful…” quote. And today that is shaping up to be an apt reference.
The flow of capital into equities (including ETFs) over the four weeks ended on October 1st was minus $9.0 billion. It turns out there’s some solid research on what equity markets do depending upon the four-week fund flow. For instance, if the number is larger than positive $12.4 billion, returns in the S&P 500 over the next twelve months average negative 13.76%. But if they’re less than $0.4 billion (we were a lot less than that!), the average return for the S&P 500 over the next 12 months is positive 24.46%. Be greedy when others are fearful…
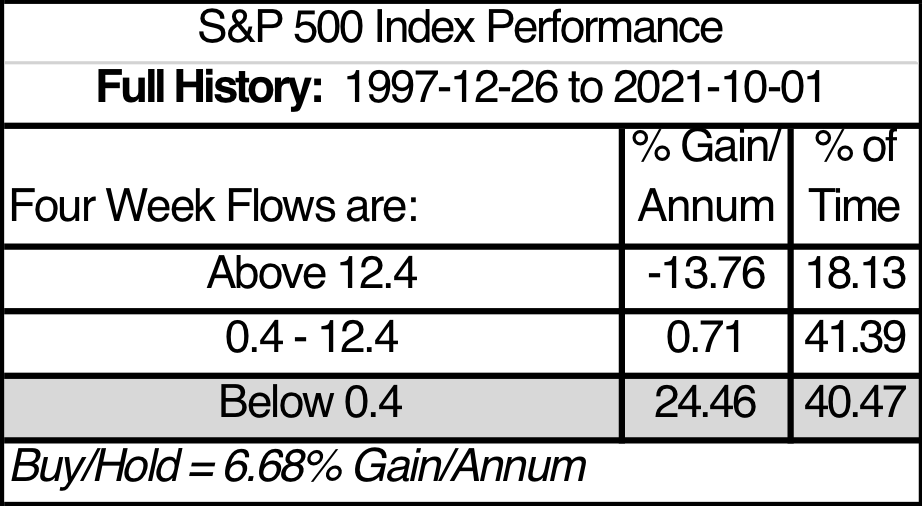
Source: Ned Davis Research
Past performance is not indicative of future results.
The caveat – as always – is that Washington, the Federal Reserve, or the COVID virus could make this data irrelevant. But when you look at this, combined with a strong Q3 earnings trend and a recovering economy? Things look pretty good.
End-of-Year Housekeeping
There are a few important deadlines and issues we wanted to run through with our current clients. The end of this year was always going to be a bit weird as we’re still waiting to hear what the new tax plan is going to look like. It’s hard to plan for it when no one yet knows what’s going to be in it.
Sometimes just the simple operational things are important as well. For example, last week we got word from TD Ameritrade on their deadline for end of year paperwork: November 15th. That is nearly a month earlier than it has been in years past. In our opinion that’s largely due to both the lack of labor available and the transition over to the Schwab platform (which we’re told won’t impact clients until at least 2023).
It’s important to understand what this deadline means. Any paperwork in by November 15th is guaranteed to be completed by the end of the year. Anything that comes after November 15th is what they call “best efforts” meaning they’ll work on it but can’t guarantee it will be completed. Right now, any transaction requiring TD Ameritrade processing is taking a week or more. That will likely get worse as we near the end of the year.
Part of our job is to drive the best-efforts process and we’ll be aggressive advocates on your behalf. But there are a few items that – if you think may need to be completed – we should attempt to wrap up in the next three weeks. Those include:
- Required Minimum Distributions
- Our team is already working hard on this process and – if they haven’t already – will have paperwork out to you shortly for your RMD.
- New account openings
- This could include setting up a new retirement account, Uni-K, SEP IRA, etc. If it’s something you need in place by the end of the year for funding, we need to get the accounts opened ASAP. And remember, it never hurts to open an account we don’t end up using. There is no cost to you.
- Charitable Giving
- This is a two-fold issue. For those of you who intend to give charitably from your retirement accounts, we wouldn’t wait until the last minute. But, more importantly, if you’re looking at tax planning techniques (like a Donor Advised Fund) which will include opening new accounts now is the time to focus on it. (Please note there is a significant process before we get to account opening on a Donor Advised Fund. If this is a priority, let us know ASAP.)
There are many other examples of items that may fall under this umbrella. What doesn’t? Trading in your account and adding or distributing funds from your accounts. We handle most of the labor on those fronts in house.
This brings up one last point: now is the perfect time to discuss any financial, tax, or estate planning needs you have. Over the last nine years, we’ve built out a tremendous platform for our clients to use that includes both the technological and professional resources you need to handle pretty much any financial issue that may arise. And if we don’t have it in house, we have relationships that can assist.
Some of you utilize all these resources. Some don’t – and that’s just fine. But if you have issues that need addressing, please call your advisor today to set up a time for a conversation. We stand here ready to assist in any way we can.
Sincerely,