
The Weekly Insight Podcast – Rollercoaster
In our last memo, we noted that the previous week was a bit of a “rollercoaster ride”. And we said about last week:
“This week will not be much better as everyone focuses on Thursday morning at 8:30AM EDT and the incoming CPI data”.
That turned out to be pretty accurate. In fact, the chart for October looks a lot like a rollercoaster. And much like a rollercoaster ride, it’s returned us to where we first began the month – almost exactly.
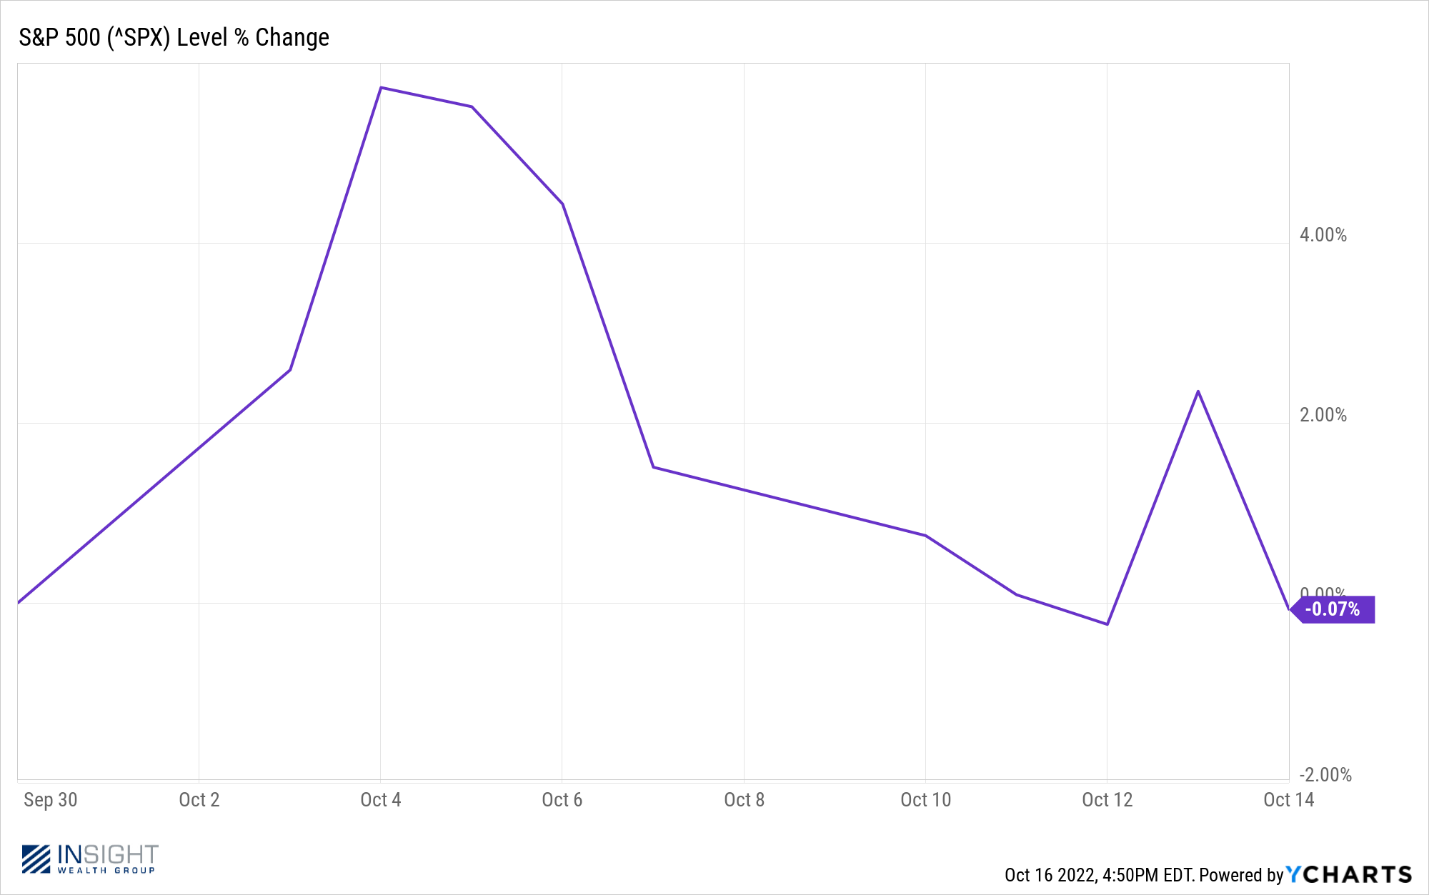
Past performance is not indicative of future results
The biggest driver of the drama this week was the CPI report. And the market’s response to it was…fascinating. Let’s take a look.
Bad CPI Good? Good CPI Bad?
We spent last week’s memo discussing how bad employment data was seen by the market as a good thing. Vice versa for good employment data. The market threw us a curveball on Thursday when it applied the same logic to the CPI data.
First let’s look at the CPI data vs. the expectations of the data prior to the report:
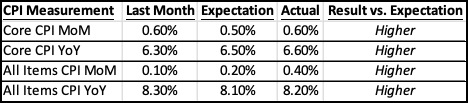
Past performance is not indicative of future results
As we have said prior to the last several CPI reports, what matters is not really the results but instead how the results stack up against the expectations. Last week? By any standard, the results did not meet the expectation. It was summed up nicely in our office text thread on Thursday morning: “That sucks”.
And it did – for a few minutes anyway. But then a remarkable thing happened: the market skyrocketed. The market opened 2.4% off the previous close. And then proceeded to climb 5.96% off that bottom by the end of the trading day.
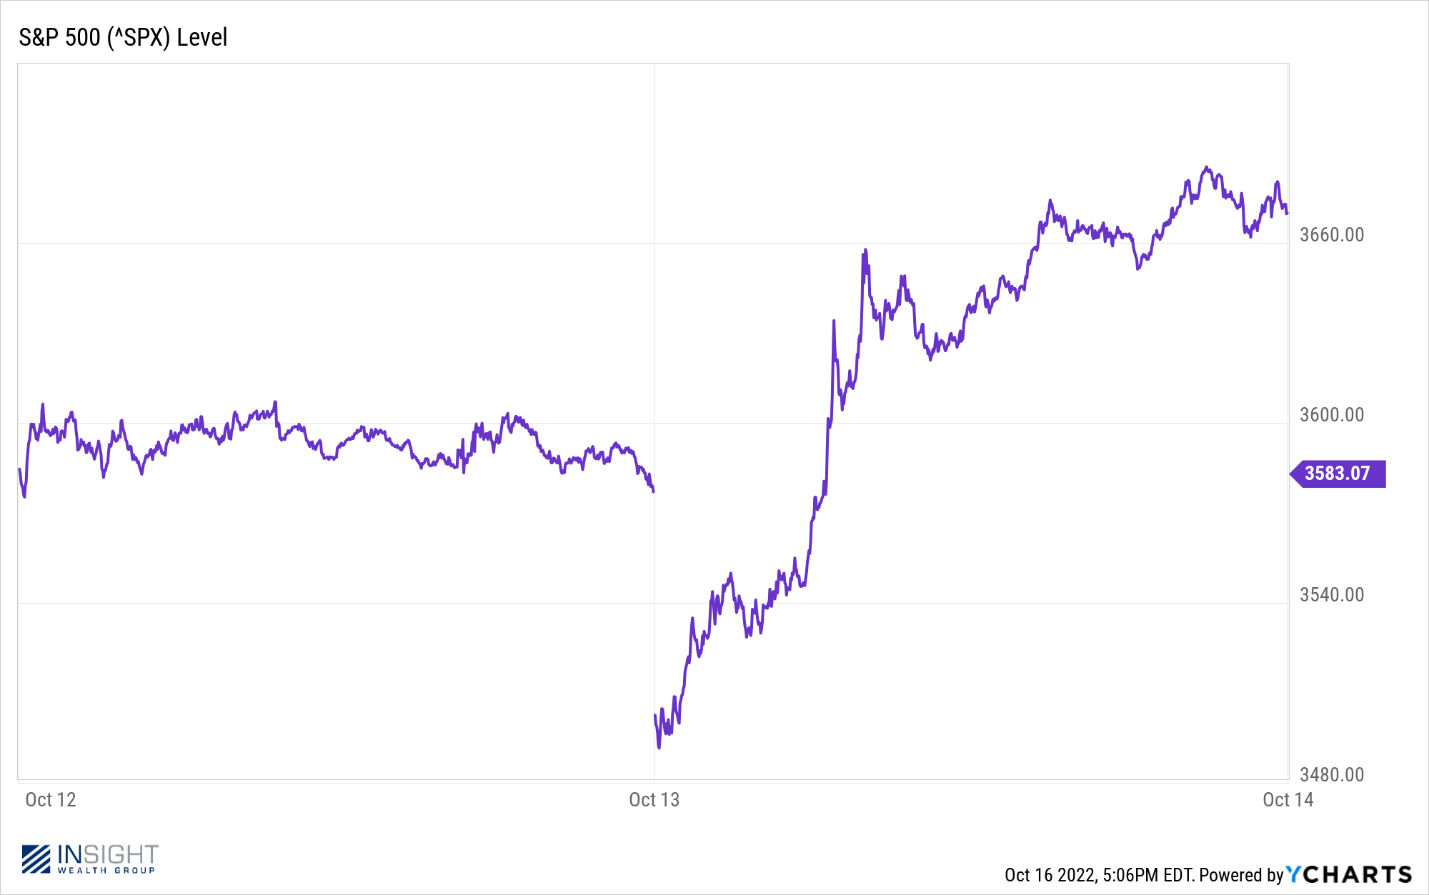
Past performance is not indicative of future results
It was not just wild – it was historic. According to MarketWatch, the movement in the Dow Jones Industrial Average made it the first time on record that the Dow “rose at least 800 points in the same trading day that it was down at least 500 points”.
So, what caused the wild swings? There are a couple of arguments we have seen that are worth looking at. The first says that, despite the misses on inflation, the market was finally starting to understand inflation overtime is moderating. It was best expressed by Christian Hviid of Wells Fargo Private Bank. We’ll let his post speak for him:
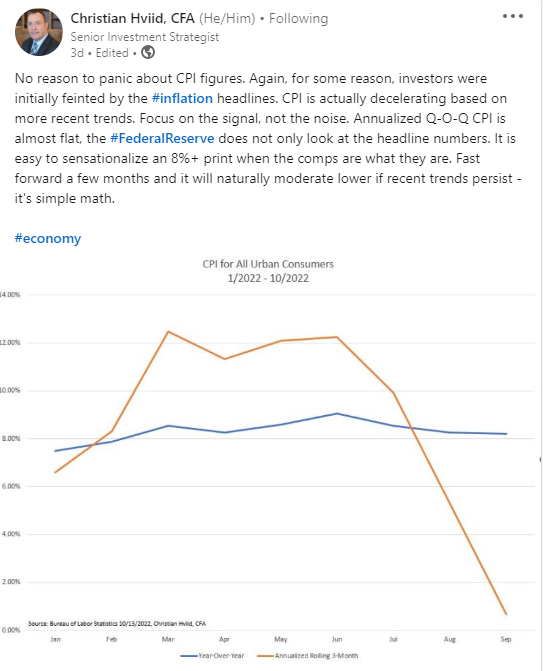
Past performance is not indicative of future results
Frankly, this is a summation of what we have been saying in these pages for some time. And after a while, we start to feel like we are beating our head against a wall on this issue. That makes it hard to assume the broader market woke up on Thursday morning and finally got on board – but any movement in that direction is positive.
The other argument? Thursday was a big “short cover” meaning people who had shorted the market were picking up shares to cover that short position. CNBC quoted Adam Sarhan, founder of 50 Park Investments, saying that Thursday’s moves were likely “a combination of short-covering and value investors stepping in”.
We’ll see in the long run but would agree with Sarhan’s next comment: “earnings season could serve as another catalyst” moving forward. And earnings season’s unofficial kickoff happened on Friday.

Earnings Season: Clearing a Low Hurdle
Much like CPI, earnings season is all about perception. We have talked in detail about how analysts typically downgrade their expectations the closer we get to earnings reports. They are constantly lowering the bar (in the hopes of not looking stupid!).
The current expectation for earnings growth is 1.6% for Q3. That dropped again last week and is down from an expectation of 2.8% on September 30th. That is an incredibly low bar. In fact, if 1.6% ends up being the final number, it will be the lowest earnings growth for a quarter since Q3 2020 when earnings dropped 5.7%.
Friday was the day the big banks reported earnings. The numbers were stark on first glance. The banks reported a 13% drop in earnings compared to Q3 2021. But what really drove those numbers? FactSet provided some interest data Friday afternoon that is worth understanding.
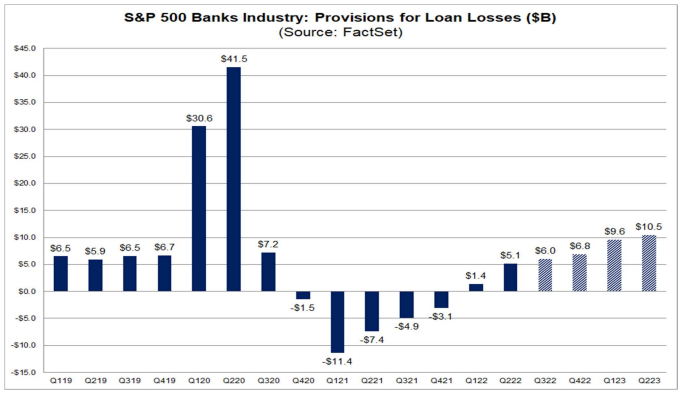
You may or may not be familiar with the term “loan loss reserves”. Essentially banks create an accounting line item setting aside reserves for losses they predict they may have in loans. While those losses may or may not happen, the reserves serve as a negative on earnings.
You may recall in 2020 that banks were creating huge reserves for loan losses which helped drive down their earnings. Many of those losses never happened and in 2021 they had “negative” loan loss reserves meaning they reduced that line item. They are now bringing those loan loss reserves back up to their historical number.
Past performance is not indicative of future results
A notable example of this, as pointed out by FactSet, is CitiGroup. In Q3 2020 they reported $2.26 billion in loan loss reserves. In Q3 2021, that number was -$192 million (positive for earnings). This quarter they came out with a $1.37 billion loss reserve. From 2021 to 2022 that means a $1.562 billion reduction in earnings.
Did they earn $1.562 billion less this quarter vs. last year at this time? No. In fact the bank reported their revenues grew to $18.51 billion in the quarter – up 6% year-over-year.
We will know a lot more about how all of this will pan out over the next few weeks, but the expectation today would be that earnings should clear the very low bar. That should be accretive to the market as we race headlong into the next round of drama: Election Day and the next Fed Meeting. More on those items next week.
Sincerely,