
The Weekly Insight Podcast – Gridlock Is Good
That’s more like it. Last week was a significantly positive week for the market and – as of Friday’s close – each major index is up substantively from the start of the month.
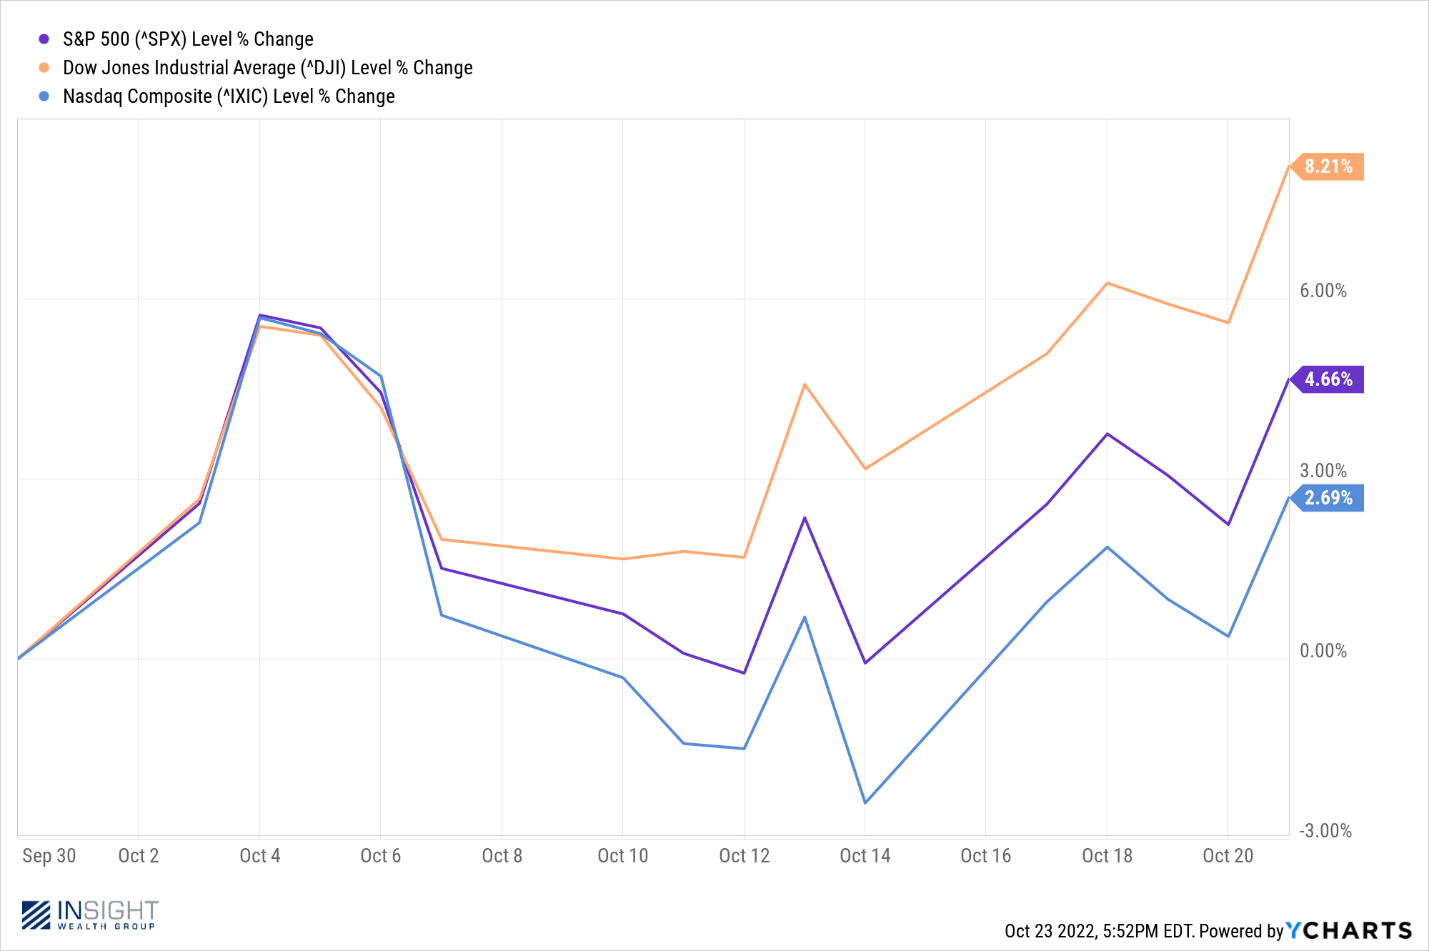
Past performance is not indicative of future results
You know the story well by now: the Fed will drive most of the performance in the coming weeks with earnings falling a distant second. The good news is we have seen positive trends on both of those fronts in the last several days.
Is this kind of movement sustainable? In the short-term, it’s hard to say. There will continue to be volatility based on Fed decisions and the election over the coming weeks. But if you have been following this commentary for long, you know we don’t make our bones trying to predict every swing in the markets. Those things are unknowable. But what we can strive to understand is the big picture. And the big picture is starting to shape up to our liking.
We are at an inflection point right now. Inflation, despite what the pundits would like you to believe, is starting to turn a corner. For example, we know today – based on the latest CPI report – 53% of the components in CPI are deflating from their “peak” today.
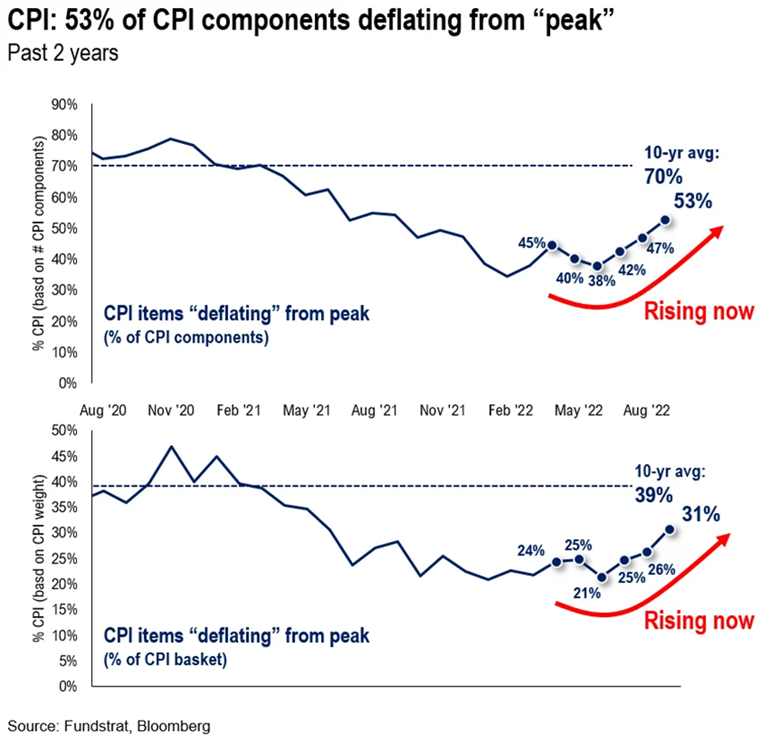
Past performance is not indicative of future results
One of the items that is not considered to be deflating – and one of the biggest components to CPI – is shelter (the cost to rent or own a home). Frankly, we are confounded by the data that came out on shelter in the latest CPI report. It surprised massively to the inflationary side. And, bluntly, we do not think that’s right.
Why? A substantial portion of shelter inflation is deduced using a single data point called “owners equivalent rent” (OER). The calculation for OER is simple: the CPI data collectors call homeowners and ask them what they think they could rent their home for in the current market. They then normalize those numbers and look to see if they have inflated or deflated and by how much. Per the Bureau of Labor Statistics, that OER number makes up over 25% of the entire CPI result. It is the largest portion of the CPI calculation.
So, let us ask you a question: do you have any idea how much your home would really rent for in the current market? We do not know about you, but we do not follow residential rental prices on our cul de sac very often. And neither do most consumers. That is why it is important to note that OER is completely out of sync with what is happening in the actual rental world.
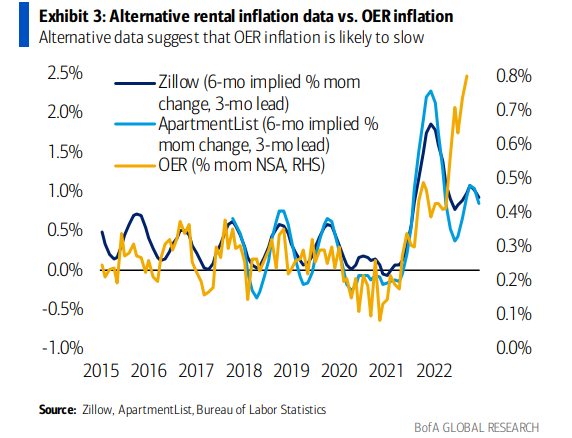
Past performance is not indicative of future results
Rent growth is shrinking at a time that OER is spiking. At the same time, we have had the most rapid deceleration ever in home prices. Granted they are still elevated, but they are certainly not growing.
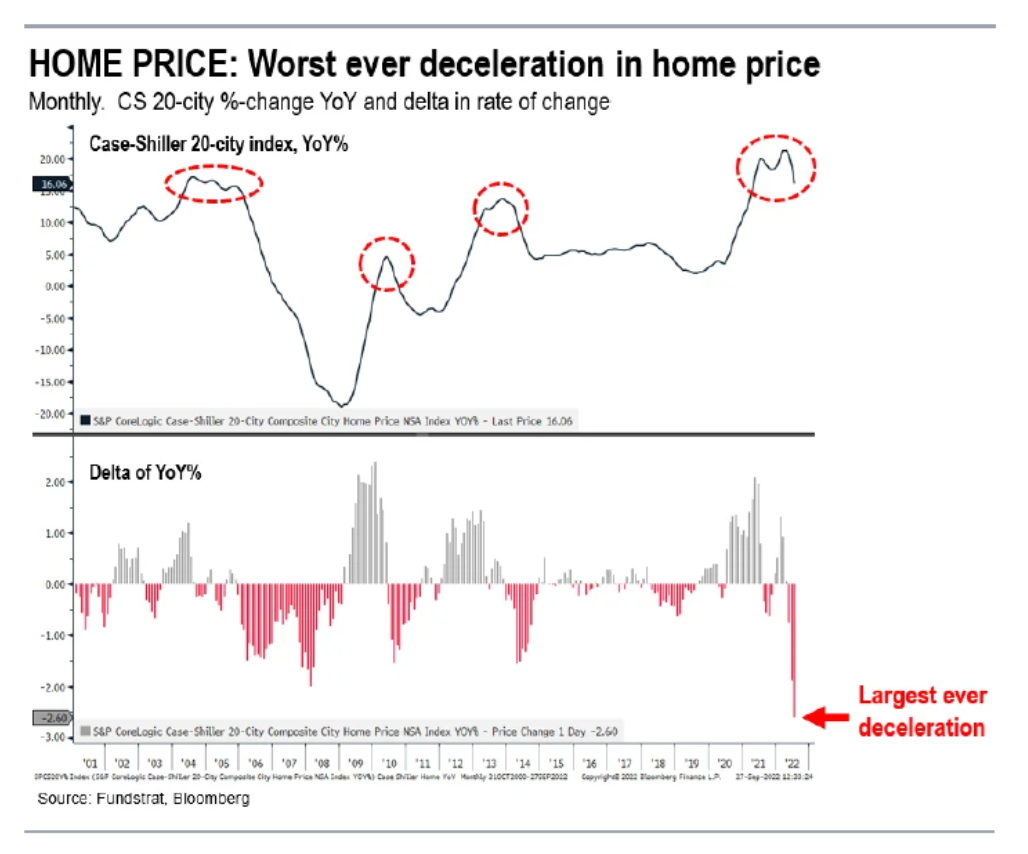
Past performance is not indicative of future growth
Long story short, inflation is moving in the right direction despite the DOL’s CPI data. We’d like to believe the Fed is doing a bit more research than “What did CPI say?”. Hopefully that will start to come through in their next meeting.

Seasonality Means Something
The big trends are starting to go our way on inflation. But what is more important is those trends are starting to line up nicely with some other big historical trends.
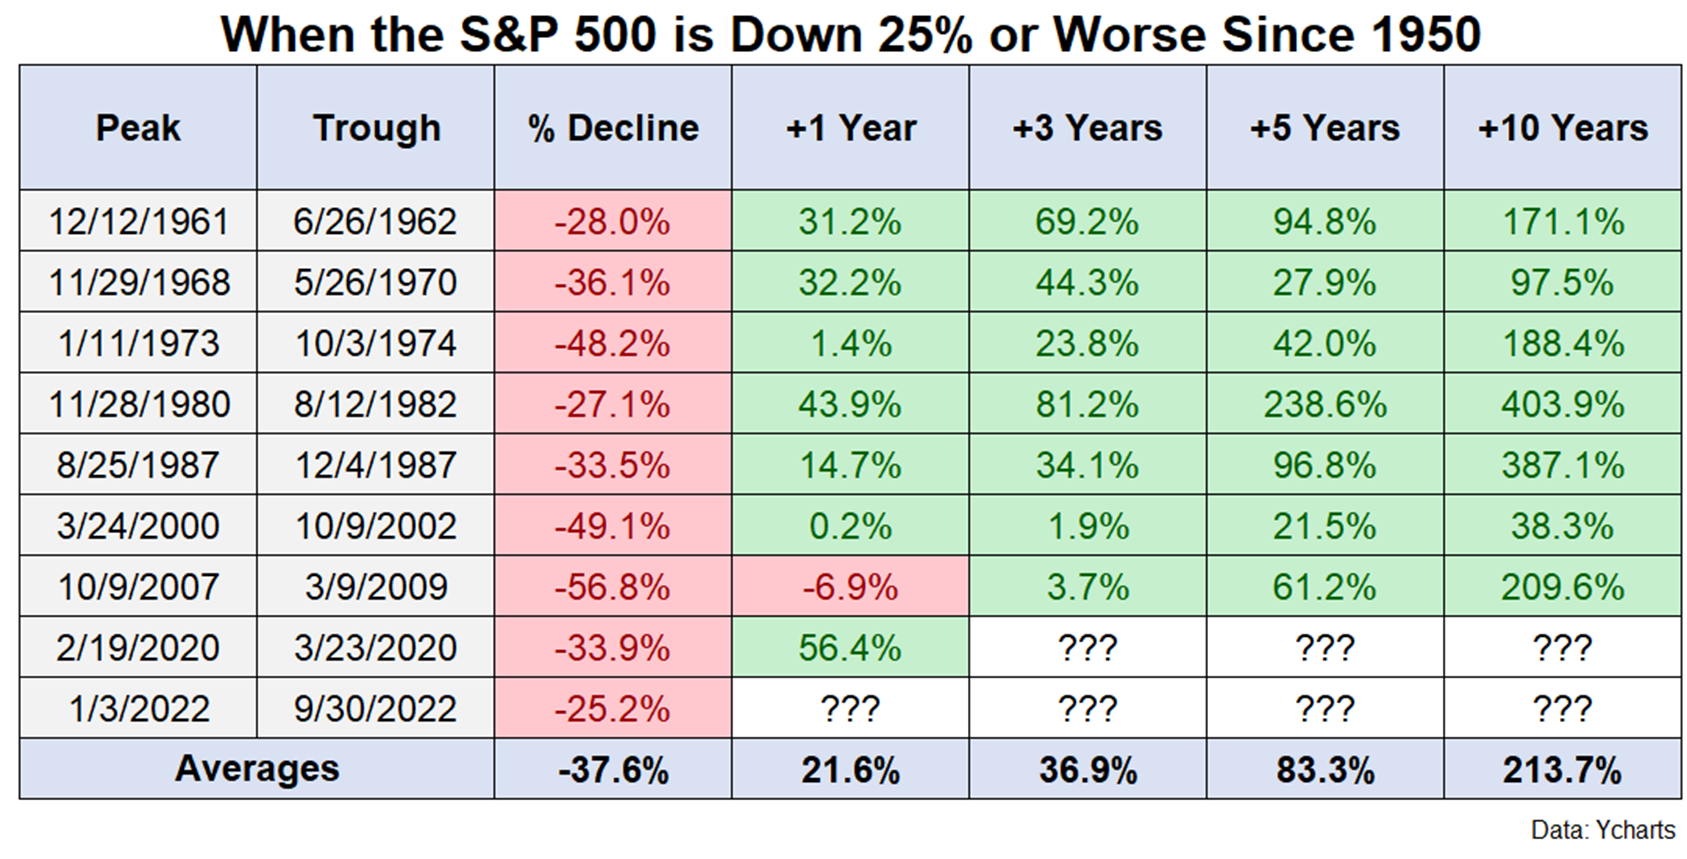
First there is the really big picture. This one ties in with our favorite and too often repeated line by Warren Buffett: Be fearful when others are greedy and greedy when others are fearful.
Why? Because every time we have had a 25% dip in the S&P 500 over the last 72 years, the results over the next 1, 3, 5, and 10 years have been stellar.
Past performance is not indicative of future results
That data ties in nicely with another big picture item: market returns relative to elections. That’s right…we finally must talk about the election. Sorry!
We know that if you break down a President’s term into the four component years, there is a distinct trend in which years to better or worse for the market. And the year that massively outperforms all others? The year after the mid-term. That would be next year.
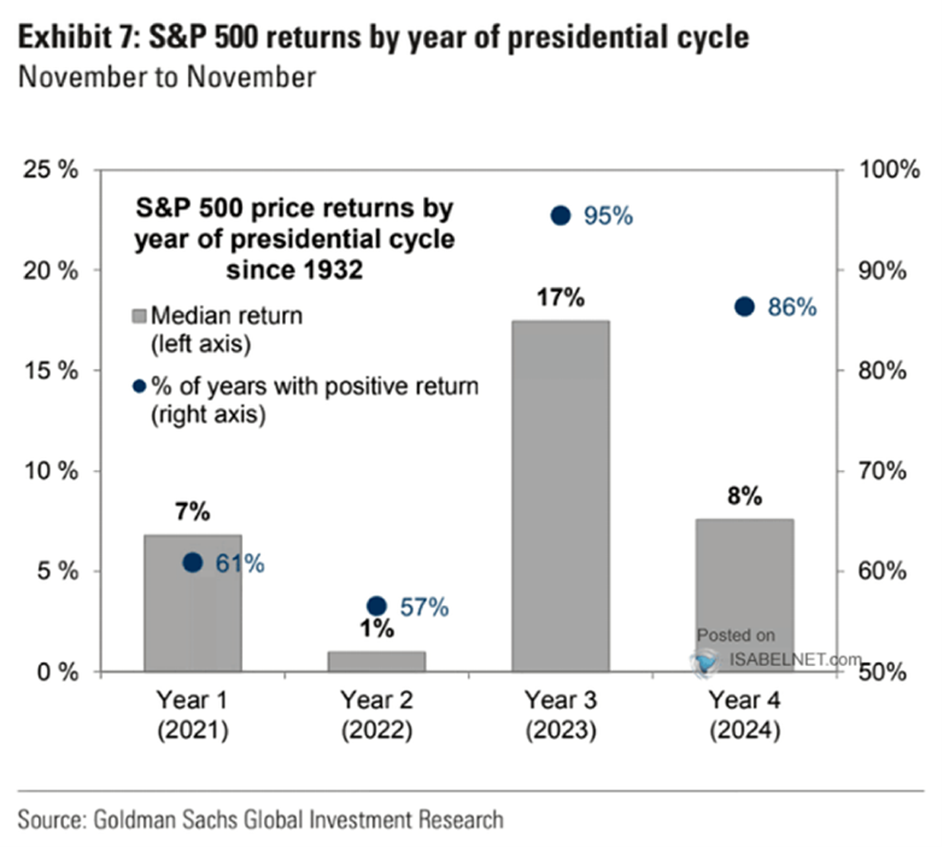
Past performance is not indicative of future results
Not only has the historical performance been nearly twice as good as any other year in a President’s term, but 95% of the year three returns have been positive going back all the way to 1932. That is a significantly better number than any other year.
OK, sure. Pull together enough random pieces of data and you can create causation. As the saying goes, there are three kinds of lies: “Lies, damn lies, and statistics”. But it is important to note this goes along with another trend: defeat for the President’s party in the mid-term.
America – for better or worse – has long held that too much power in the hands of one party is not a good thing (we agree). And so, repeatedly, the President’s party has almost always suffered badly at the voting booth in the mid-term. In fact, there have only been four times since the Civil War (40 mid-term elections) in which the President’s party has gained seats.
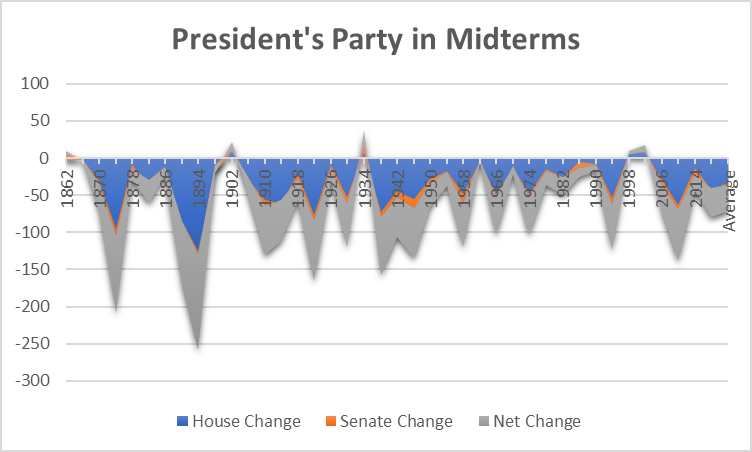
Past performance is not indicative of future results
As we have discussed in these pages before, the market and the voters agree, albeit for different reasons. The market loves divided government because it means Washington is stuck in gridlock instead of changing the rules of the game on Wall Street and in boardrooms across the country.
We are not in the business of predicting elections, but those who are remain convinced gridlock is what we are going to get. The current odds right now show an 80% chance the GOP will win back control of the House. And they are nearly evenly split (55%D/45%R) on who controls the Senate.
Those odds make gridlock likely in just a few short weeks. Why? Because if the GOP takes either house of Congress, expect them to spend the next two years tying the Biden Administration up in investigations. How do we know that? Because they said so. Likely GOP Majority Leader Steve Scalise (R-LA) was quoted as saying:
“I think it’s really going to be focused on holding the Biden administration accountable and getting answers…It’s going to be a lot of intense oversight”.
Is that right? Wrong? Our readers – and even those in our office – will not agree. But it does make the trend of the President’s third year much more likely. And that would go nicely with a move downward in inflation.
Sincerely,