The Weekly Insight Podcast – New Rules: Energy
Last week, we took a deep dive into the impacts of the Federal Reserve’s 75-basis point rate hike. Readers of that memo (here) will know we weren’t exactly…impressed. Simply put, the Fed changed the rules of the game in the middle of the seventh inning. That may have made the market happy in the short-term, but it’s not good for managing expectations going forward.
It became clear from the Fed’s decision the market’s sentiment mattered more than anything. And by untethering interest rate policy from the core economic data that has driven it for so long, we’ve also untethered sentiment. The result? Market volatility. That volatility was “good volatility” last week, with the market up 6.45%. But that likely won’t always be the case.
Sentiment is going to rule the roost until we get some hard economic data that will get us back on a data driven approach to interest rate policy. So, this week, we’re going to dive into those “new rules” and look at what they may mean for the future. The good news? There might be some hope on the horizon.
Core vs. Headline Inflation
The big shift in the Fed’s announcement was their move away from “core” inflation to “headline” inflation as their justification for a larger rate increase. Before we get into what that might mean, let’s do a quick refresher on the difference between core and headline inflation and what they’ve been doing over the last few months.
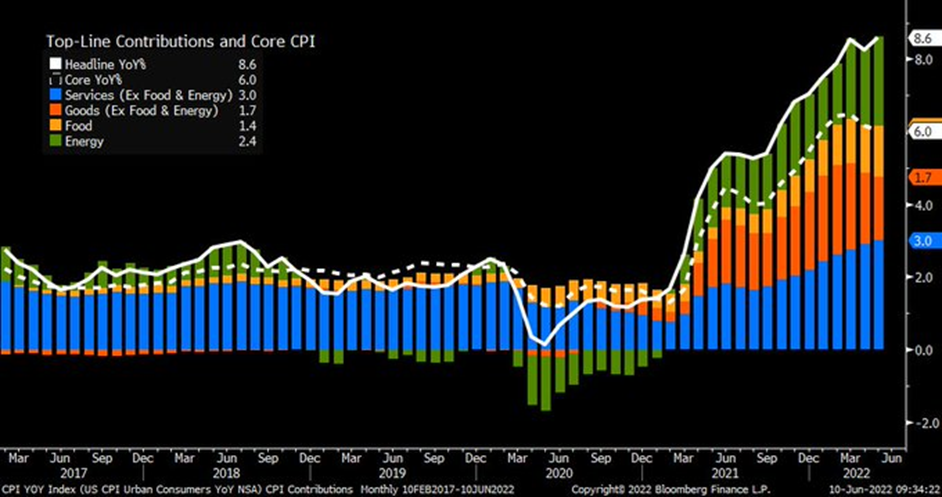
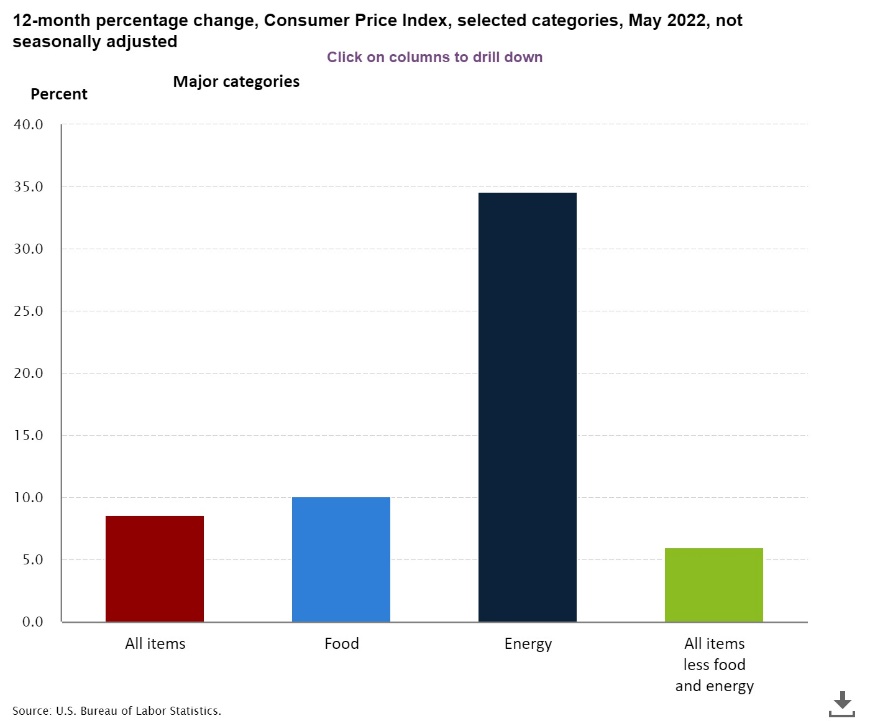
Headline inflation is also known as “all-items” inflation. Simply put, it is all inflation. And it was the number that shook the market most in last month’s reading, rising 8.6%.
Core inflation is headline inflation minus food and energy inflation. It has, for more than 40 years, been the standard for interest rate policy decisions. Why? Because as Chairman Powell noted last week, it is the best predictor of future inflation. And food and energy inflation is historically divorced from broader economic issues and can run hot or cold on its own. Core inflation has now fallen for two months.
Past performance is not indicative of future results
Energy Is the Biggest Game in Town
Both food and energy inflation have been running ahead of core inflation for the last several months. And last month it was significantly worse. But while food is high, energy was by far the biggest driver.
Past performance is not indicative of future results
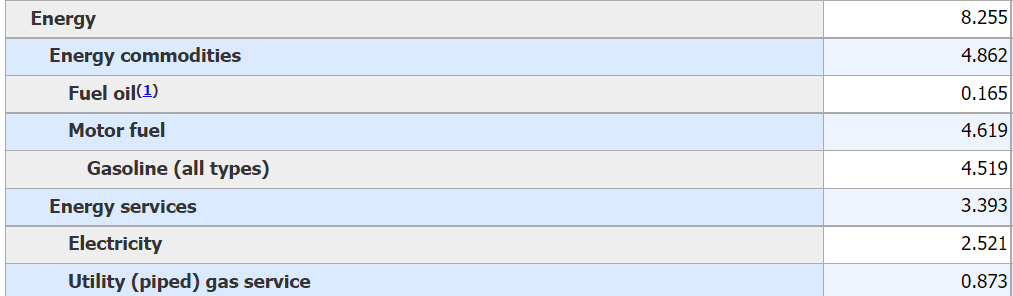
When we think about inflation, we must think of it as a pie. Each area of inflation makes up its own slice which – when added together – completes the whole. The energy piece of that pie, in last month’s report, made up 8.255% of the pie. Let’s look at how each of the energy categories fit inside the energy slice.
Past performance is not indicative of future results
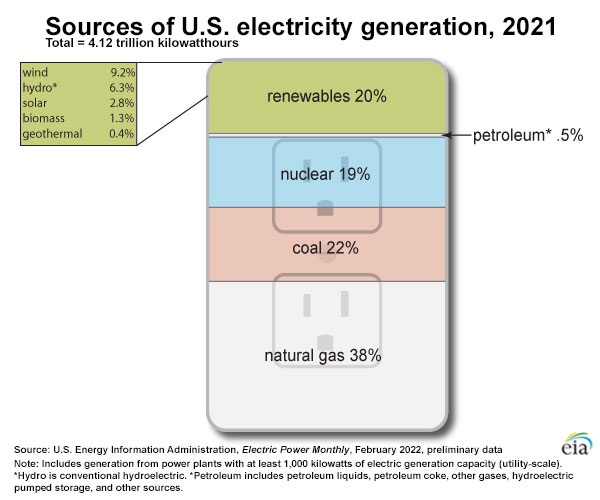
As the chart above shows, spending on gasoline accounted for 54.74% of the energy inflation last month. Beyond that, the data gets a little fuzzier in this breakdown from the Department of Labor. It notes that 0.873% of all inflation (or 10.58% of energy inflation) comes from piped gas (natural gas). But the electricity section is a little fuzzy. We can then look at data from the Department of Energy to see that – last year – 38% of electricity production came from natural gas.
Past performance is not indicative of future results
As such, roughly 38% of the weight to electricity should be added to the natural gas bucket (roughly another 11.60% of energy inflation). That means 54.74% of energy inflation came from gasoline and 22.18% came from natural gas. The rest (roughly 23.08%) came from other sources.
Let’s put our focus today on the nearly 77% of energy inflation that came from those two commodities – gasoline and natural gas. What has happened in those commodity prices since the start of June? Should we expect headline inflation to rise or fall next month on the back of energy inflation?

Gasoline Prices
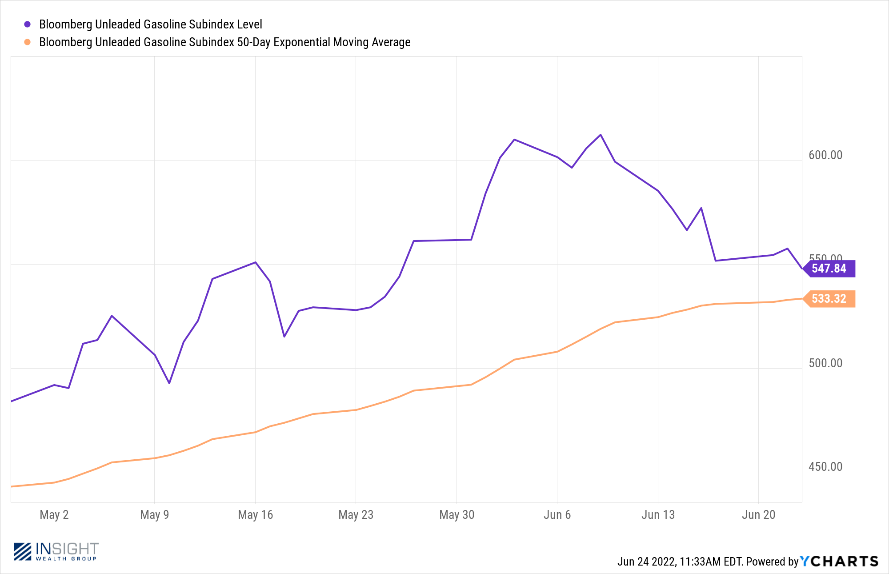
There is short-term good news on gas prices right now. They are falling from their peak.
Past performance is not indicative of future results
The not so good news is that the peak happened earlier this month. The daily average during the month of May for the above noted Bloomberg Unleaded Gas Subindex was 525.29. The average so far for the month of June is 582.82. That number is falling but will have to fall significantly more before we would see a net drop between May and June.
Let’s assume (you know what they say about assuming!) that the price for unleaded remains flat for the rest of the month. If that were the case, the June average would end up being 574.49. That would be inflation in gas prices for the month of June of 9.37%. That is significantly larger than last month’s 7.6% increase.
Natural Gas Prices
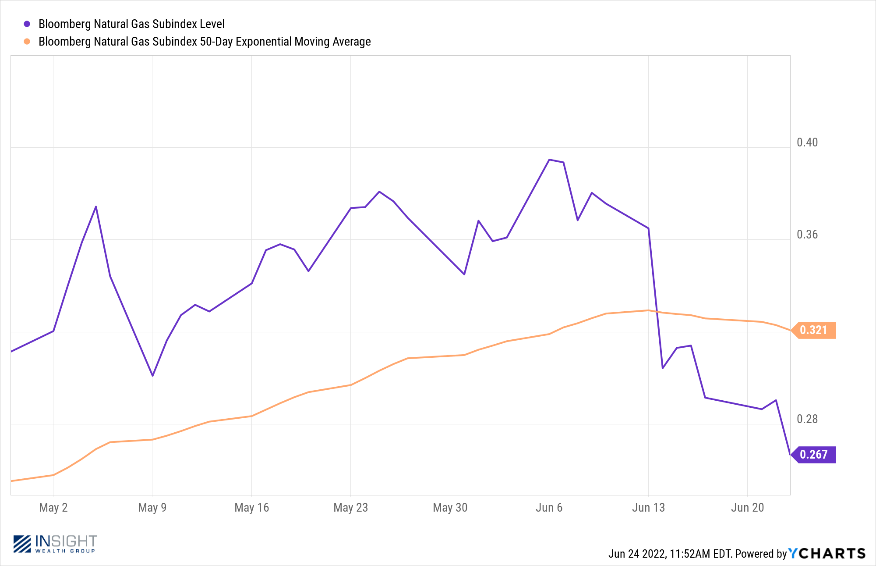
The hidden story right now is on natural gas prices. They have fallen a stunning 32.43% since their peak on June 6th. Again, assuming no further movement for the rest of June, that would result in a 7.58% drop in the price of natural gas for the month. That would be a stunning reversal from the 7.8% inflation we saw in the month of May.
Past performance is not indicative of future results
What This Means for the Future
The above data is a bit of a mixed bag. Yes, prices are beginning to drop. But they may not be dropping rapidly enough (in the case of gasoline) to markedly improve the headline inflation print for the month of June. Right now, analysts are expecting a slight drop in headline inflation from 8.6% in May to 8.3% in June. That’s good news – but does not a trend make. In fact, 8.3% is exactly where we were back in April.
But the trend matters, especially in the case of natural gas. Why? Because there are structural issues in the gas industry that will take considerable time to resolve. Interestingly, this is a story that hasn’t gotten a lot of attention. It should.
On June 8th there was a significant explosion at the Freeport LNG terminal in Texas. This explosion, which was initially viewed as a short-term issue, now looks like it will take six months or more to repair. It is taking the entire Freeport terminal offline. Why does this matter? Because the Freeport terminal makes up 20% of the United States’ natural gas export capacity and exports make up 12% of our entire natural gas market.
That means 2.4% of our natural gas supply now has nowhere to go. So, for the next six months it’s going to be able to go to other domestic uses and – particularly – into storage during the time of year when natural gas demand is the lowest.
Don’t get us wrong – we’re not about to see natural gas prices back at their pre-COVID lows. Energy is still one of the best investments out there today in this inflationary environment. But this will keep natural gas prices lower as we head through the summer. This explosion – while tragic for the industry – may end up being the golden ticket out of higher headline inflation.
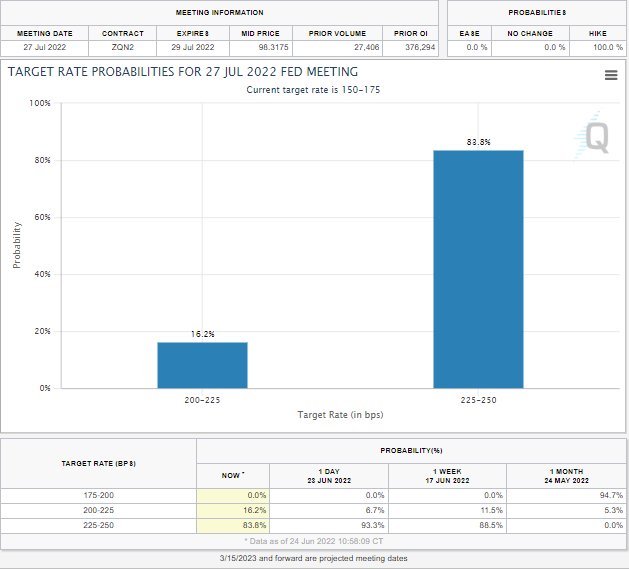
So where does that leave us? Optimistic in the medium term (next three months) about where headline inflation is going. But also skeptical in the short-term about what the July inflation print will be. It turns out we’re not alone. The market is currently putting the odds at 84% that we’ll see another 75-basis point rate hike in July.
Past performance is not indicative of future results
But we must remember from last month just how quickly that sentiment can change. If the inflation data comes out better than expected on July 13th, we’d expect sentiment to shift quickly as well. And it seems like sentiment is all Chairman Powell and the FOMC are concerned about right now.
Sincerely,