The Weekly Insight Podcast – Are We Bulls?
Inflation. Interest rates. COVID. Ukraine.
Inflation. Interest rates. COVID. Ukraine.
Inflation. Interest rates. COVID. Ukraine.
Over, and over, and over again these topics have been beaten into our heads. Why? They have been the big scary stories. They are the things people are talking about on the news. And they are the issues clients are coming to meetings asking about.
They are important stories. They are landscape shifting stories. But they’re not everything.
One of the things we’ve been struggling with at Insight over the last few months is, while we feel it is especially important to study, understand, and discuss these items, we also don’t share the (often) prevailing pessimistic view. We’ve tried to work our worldview into our discussion of these topics. But the topics themselves have become the story.
You have heard us do some complaining in the last few weeks – especially about the “financial gurus” who plant a flag in the ground, definitively declaring what is going to happen in the stock market or the economy. We do not have that level of ego. Frankly, anyone reading this knows there is no foretelling the future.
In that regard, we’ve never been bulls or bears. Instead, it’s our job to move toward daylight in whatever environment we find ourselves in.
But today? Today we’re looking at this environment more optimistically than most. So today we’re going to tell you why.
Valuations
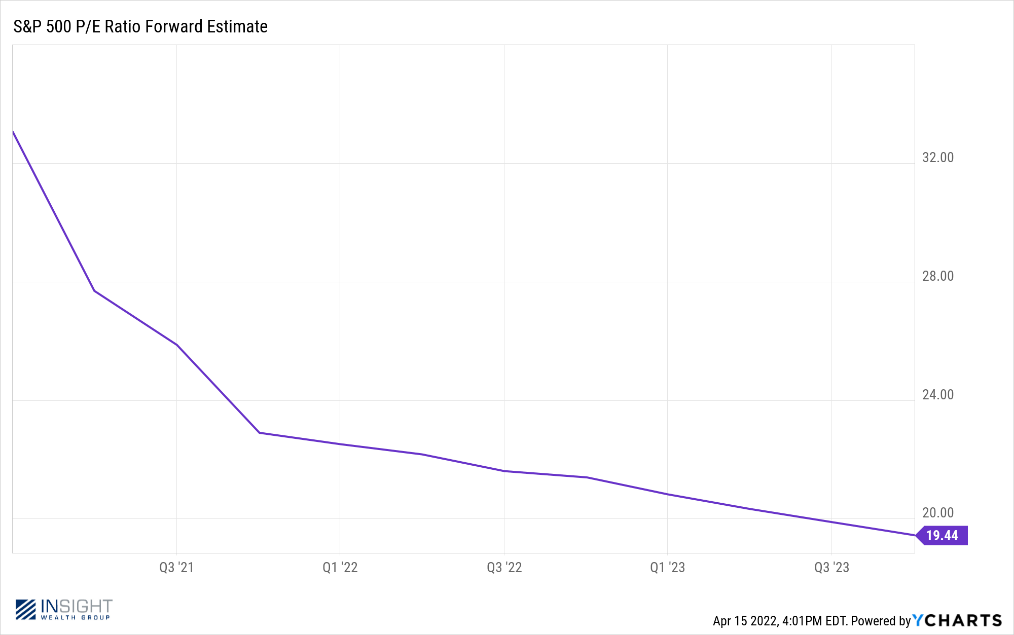
The S&P 500 ended the holiday shortened trading week with a forward P/E of 19.44. We’ve beaten the P/E question to death in these memos, but we’ll just say this: that’s only slightly above the 10-year average of 18.5x. More importantly that number has moved down significantly in the last year.
Past performance is not indicative of future results
Throw into the mix that we’re looking at an estimated 9% earnings growth in FY2022 and something must give. If the market stays flat between now and the end of the year, the S&P 500 would be trading at closer to 17x forward P/E. It hasn’t traded in that range in a long time and – given the yield for bonds today – there is little justification for it.

Inflation
Yeah, we know. We’re all sick of this conversation. But this week we want to make it clear: this rise in inflation is going to come to a natural end. And we think it’s going to happen sooner than the pundits on TV are telling you.
We’ve made the case for several leading indicators over the last several weeks. We’re going to make them again to make sure everyone is hearing us.
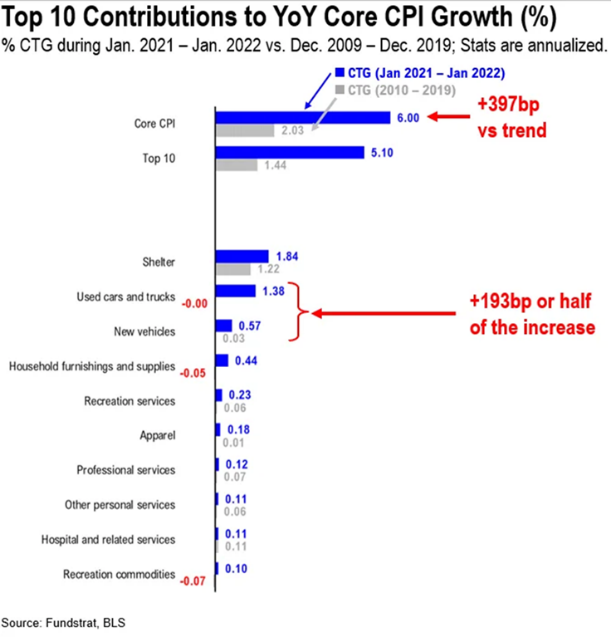
Before we can understand why these numbers are important, we first must understand what has made up the inflation we’ve seen. As you can see from the chart below, most inflation has occurred in just a few areas. Nearly 49% of the growth has come from the cost of new and used cars. 16% has come from the cost of shelter (rent & home ownership). 11% has come from the cost of household furnishings.
Past performance is not indicative of future results
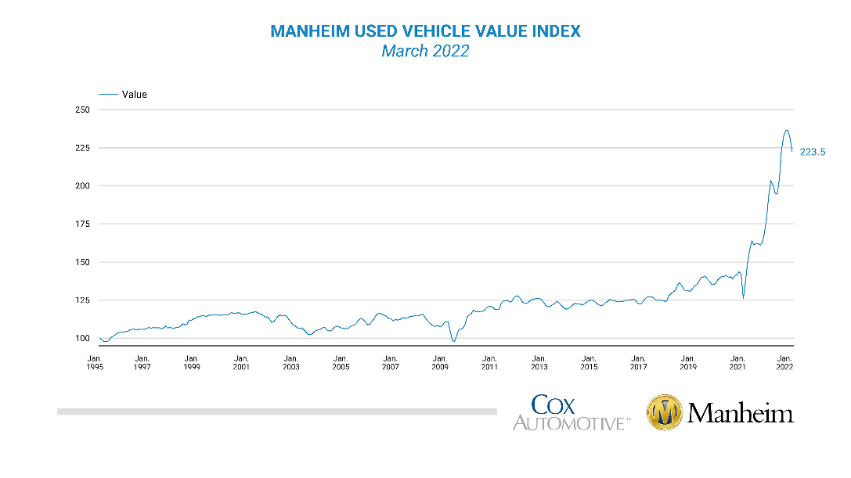
The world is changing in many of these categories. Used car wholesale prices have dropped for consecutive months.
Past performance is not indicative of future results
Consumer orders of durable goods (household furnishings) has collapsed in recent months.
Past performance is not indicative of future results
And the rise in mortgage rates is already cooling off the growth in home prices (although we feel like this will likely be the last big holdout on the inflationary side).
And we promised you in our last memo we would talk about the inflation numbers that came out last week. Depending upon your source, the news was either good or bad. CPI rose 1.2% month over month. That is certainly a substantial number. But if you exclude energy and food – getting you to Core CPI (the number the Fed uses) – it rose just 0.3%. That was well below the expectation of 0.50% which was also the reading in February. Yes, that’s right, the speed at which inflation is growing (not including energy), is slowing.
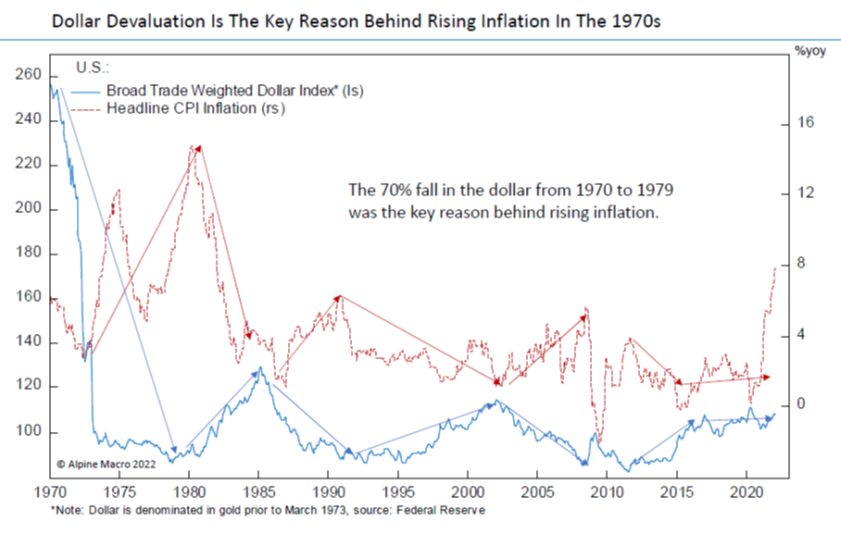
That leads us to a question we get a lot: is this the return of the 1970s? NO! Yes, inflation at these levels is significant. So significant, in fact, we haven’t seen it in over 40 years. But the driver that we saw in the 1970s isn’t there today: the devaluation of the dollar.
Several issues drove the inflation of the 1970s, but the first amongst the causes was the devaluation of the dollar. When Nixon took us off the gold standard, the dollar fell 70% in value over the next 10 years. As the chart below shows, inflation rises when the dollar falls and vice versa. Today? the dollar is stable to rising.
Past performance is not indicative of future results
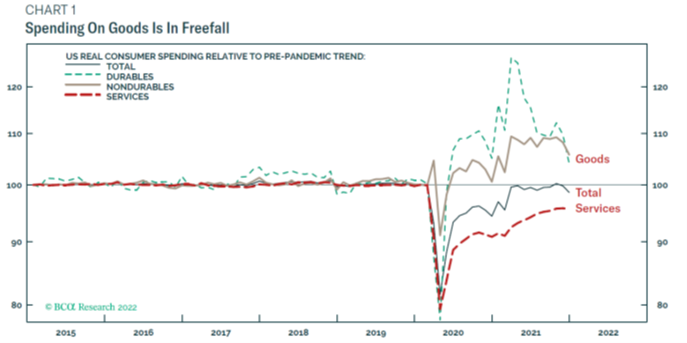
The Consumer is HEALTHY!
Part of the cause of inflation is the massive amount of spending that has happened since the start of the pandemic. We’ve discussed ad nauseum the source of that spending: free government money. But here’s the thing: even with all that spending, consumers continue to remain in great shape.
They have more cash in bank accounts than they’ve ever had.
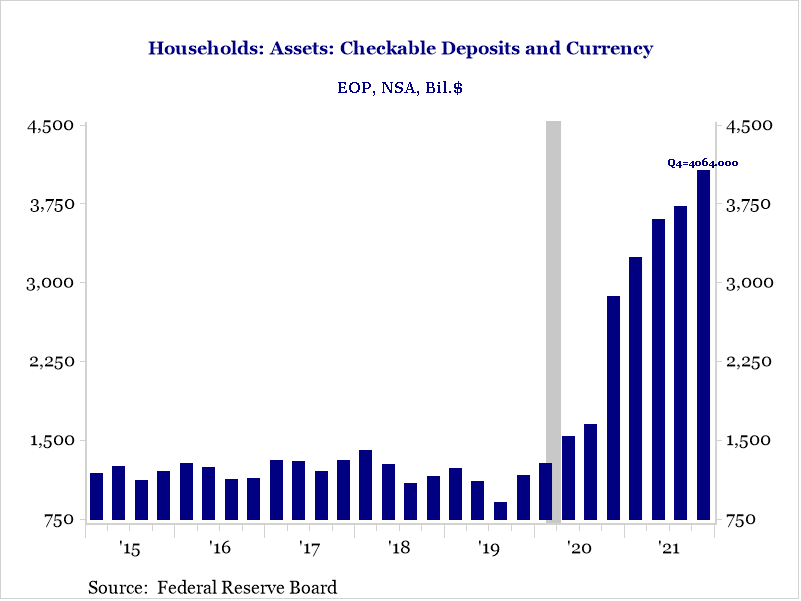
Past performance is not indicative of future results
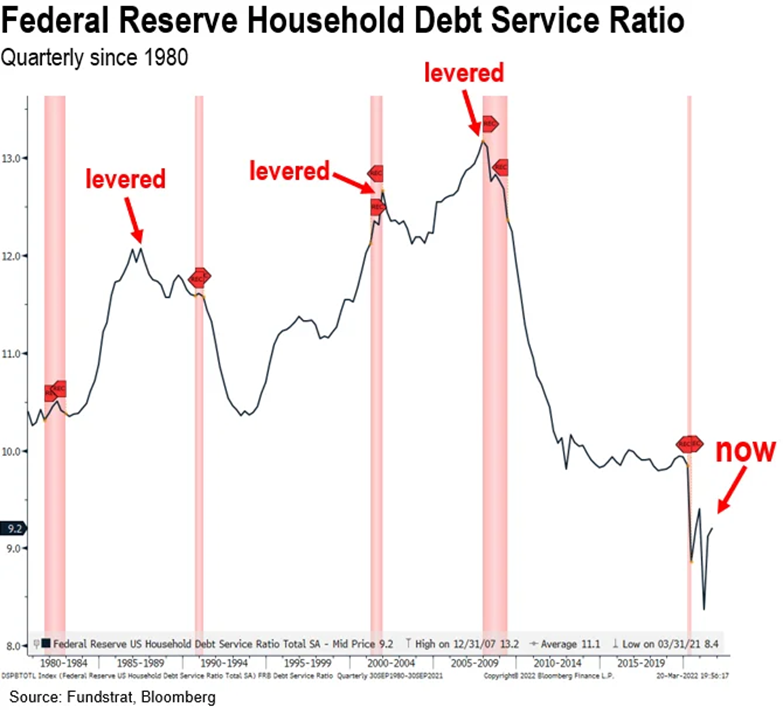
And the amount of money they’re spending on debt payments is not at the lowest level in 40 years – but it’s close. And it’s a lot lower than it was pre-pandemic.
Past performance is not indicative of future results
Consumers cleaned up their balance sheets during COVID. Yes, it came with an assist from the government. But it means something as we deal with inflation. If consumers have the cash to pay for the higher prices, we will be able to withstand the surge. And right now, they do have the cash.
Sentiment
We come back to a lot of common themes in these pages. Why? Because they’ve worked. And to steal a line from the great Wayne Gretzky, our job is to “skate to where the puck is going, not where it’s been.”
Sentiment – both consumer and investor sentiment – is very often a backward-looking indicator (where the “puck has been”). That’s as true for professional money managers as it is for the everyday investor. And today sentiment is at one of its lowest points in the last decade. In fact, it’s worse than it was in the days following the initial COVID correction!
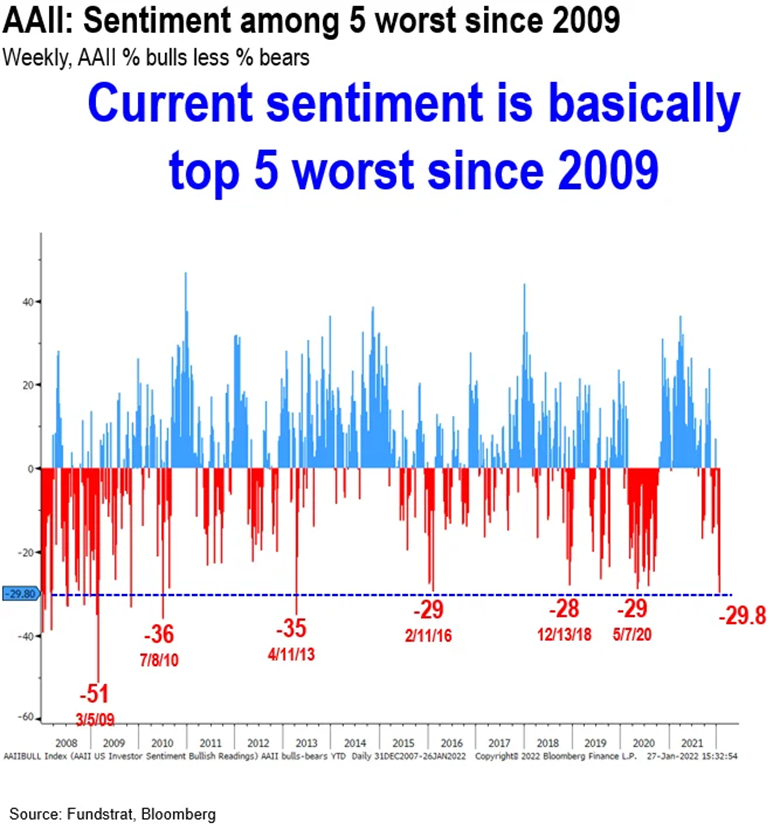
Past performance is not indicative of future results
So, what happens in the market after we’ve seen these levels of pessimism? Historically we’ve seen outsized growth in equities. And it’s not just a little bit. 12 months later the market has outpaced “non-pessimistic times” by over 38%.
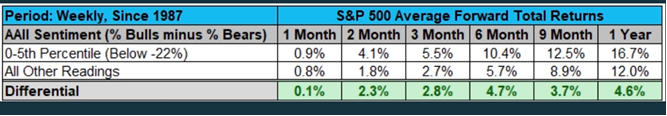
Past performance is not indicative of future results
So, Are We Bulls?
As we said at the beginning, no one can see the future. We all learned that lesson the hard way in March of 2020. But the world – and the market – has priced in a lot of downside to this market: seven interest rate hikes, sky rocketing inflation, the worst ground war in Europe since World War II. All of those (and more) have created an environment where the market S&P is off 8% and the NASDAQ is down 16% in a time when consumers are flush, markets are fairly valued, inflation is stabilizing, and sentiment is bad. We like those odds.
Sincerely,