
There is a great line from the Joker in the movie The Dark Knight (a must watch if you haven’t seen it – but we are about to spoil the ending…). To set the stage, he has two ferries (full of people) filled with explosives. Passengers in each ferry hold the trigger to the other ferry’s explosives. He is trying to prove the point that people will kill indiscriminately to save their own skins.
As the deadline approaches, he looks at Batman and says – rather dramatically – “And. Here. We. Go.”

The only problem? Neither ferry can bring themselves to kill the other. And nothing happens. His plan fails. The message? Despite all our problems, people are inherently good.
Last week was a bit of a “Here we go” week in the markets. We had some exceedingly popular stocks take a big tumble. The NASDAQ officially entered correction territory (down 10% from its high). Famous investor Jeremy Grantham declared the end of the bull market. Shares of growth favorite Peloton collapsed.
But while markets are not inherently good or bad, there are good and bad assets. And while there is a lot of drama happening in the markets, there are fundamentally sound aspects of it that are worth remembering when have periods of volatility like we are seeing today.
The Jokers
We have talked for the last several weeks about the volatility in large cap stocks – particularly large cap tech stocks – and their vulnerability to the decisions of the Federal Reserve. Like it or not, the vast majority of S&P 500 performance was driven by very few names last year. As you can see from the chart below, over 35% of the market’s performance came from just five names!
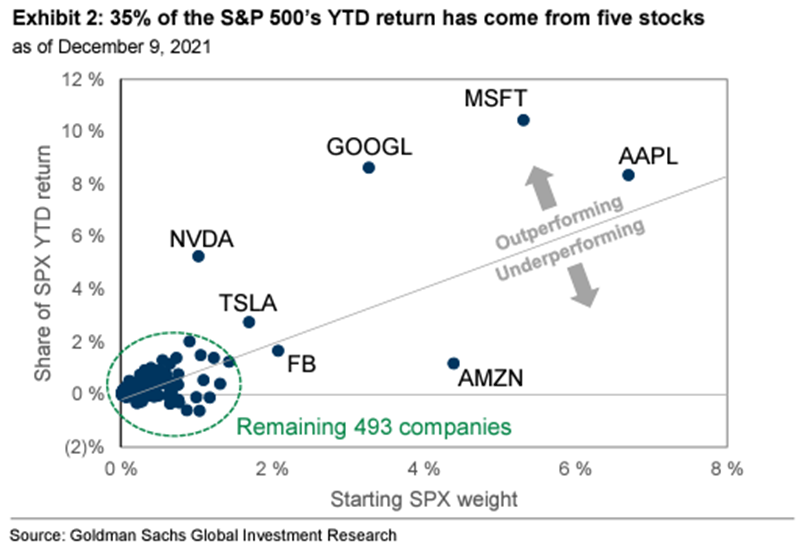
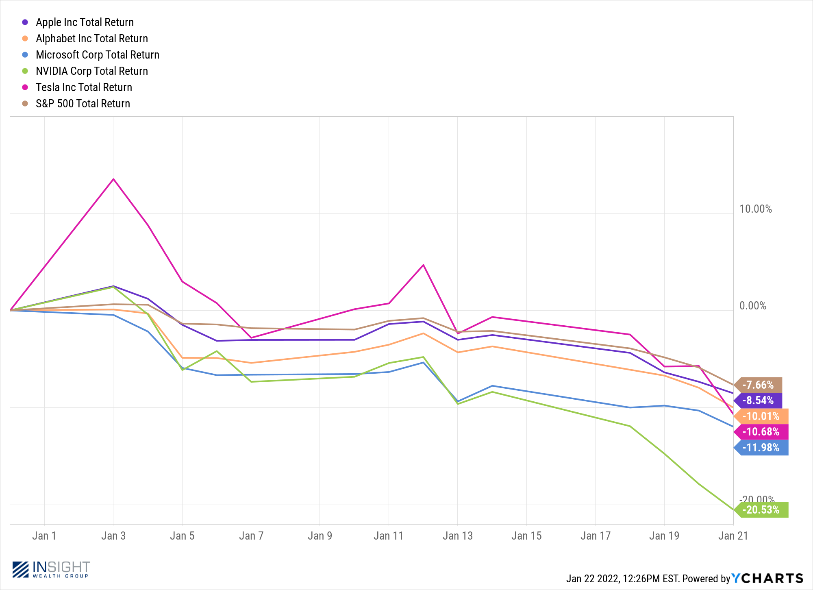
So, maybe it should not surprise us that the market is down 7.66% year-to-date (through Friday) when the performance of those same names looks like this for the year. These are the very companies that are going to suffer the most from the end of “easy money.”
And that brings us to Mr. Grantham’s comments about the end of the “Super Bubble” in equities. To be clear, neither we nor Mr. Grantham can know if he is correct. In fact, even he has said that there is a difference between identifying an asset bubble (fairly easy) and identifying the timing of when it will pop (nearly impossible). So, we do not want to be too hasty in calling an end to the “bubble.”
But it is important to identify what the bubble actually is. We would argue you can see it in the charts above.
A crucial point we have made before: the S&P 500 (and most indices) is a “market cap weighted” index. That means the bigger the company the more of the index it makes up. So, let’s look at those five companies. As of last week, they made up 20.53% of the S&P 500. Five names. Well, really six as Google is split into two stock tickers (GOOGL and GOOG). But still. That means the other 494 names equaled just 79.47%.
Here’s where the math comes in. Other than Google, those names have significantly elevated forward price-to-earnings ratios. They range from 22.78x earnings (GOOG) to 97.57x earnings (TSLA). The current forward P/E for the whole index is 20.10.
But here is where it gets fun. If you remove those six names from the S&P? The forward P/E ratio looks more like 18.55x. While that is a bit high, it is not extremely overpriced. It is certainly not a bubble.
We saw what it looks like when people get a peek behind the curtain earlier this week with Peloton stock. This company – which had been trading at over 800 times forward earnings – collapsed when they announced that they were cutting production as future sales were lagging. Investors who had been counting on unlimited growth had to step away. The stock, which had been trading at as much as $86 per share three months ago closed on Friday at $27.06, nearly $2 below its IPO price.
In truth, we are a little bit like Grantham. He has said in the past that his investors have had to remain patient while his bubble strategies have played out. He can look wrong for a long time before the result justifies the means. The same can be said for our avoidance of names like Tesla and Nvidia. We have left some money on the table in the short-term, but as these names come back down to earth we are going to be awfully glad we did not jump in.
The Case for Good
If the bubble in tech stocks is the Joker, the case for the good in people is in fundamentals elsewhere in the market. We have often discussed investors recurring tendency to buy and sell at the wrong time. The last two years was no different. Below is the chart on the S&P and the Barclays Aggregate Bond index for 2020 and 2021. As you can see, equities were the place to be, and bonds were the place to avoid – even with the COVID correction in early 2020.
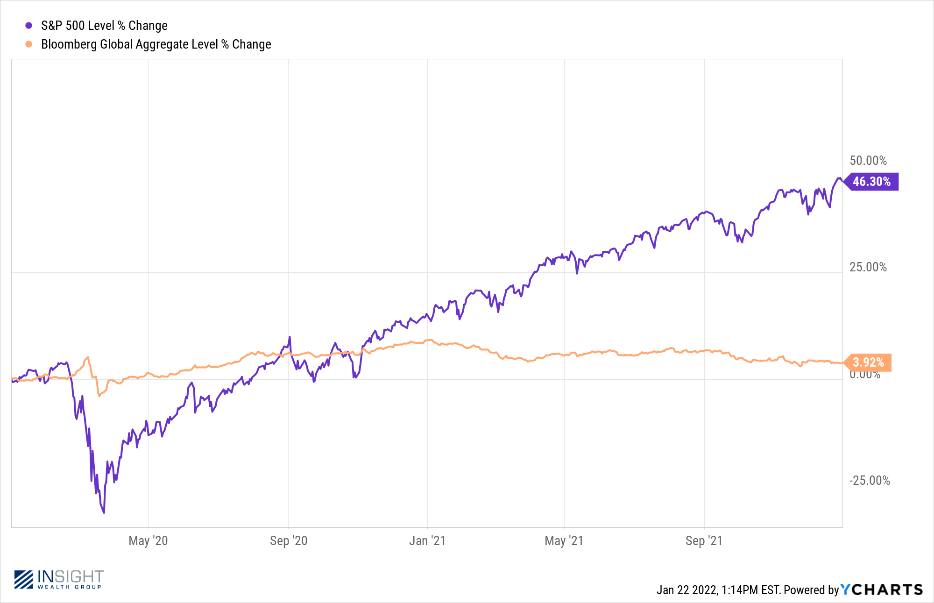
But that’s not what investors did. There was a net outflow to equity mutual funds and ETFs of $141.4 billion over the two-year period. In the meantime, $1.908 trillion flowed into bond funds (exceptionally low returns) and money market accounts (negative real returns).
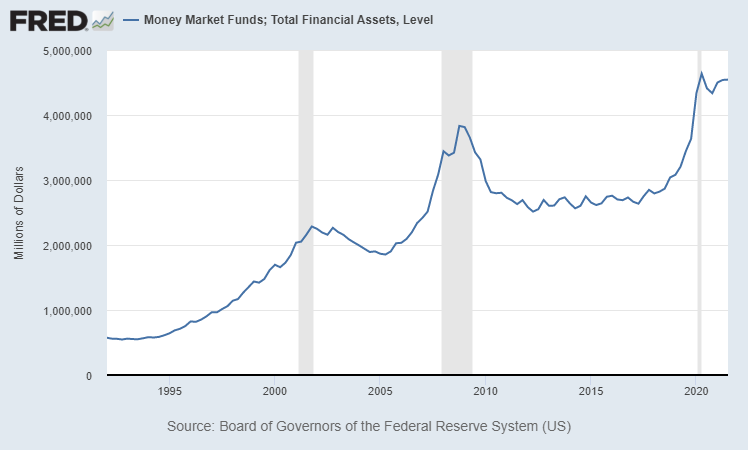
What that means today is there is an amazing amount of excess cash in the system today. There is more than $4 trillion available in money market accounts today. That will undoubtedly serve as a “shock absorber” to the system if selloffs continue.
In the meantime, there are still opportunities to own high quality, “unsexy” companies at good valuations. Earnings, dividends, and low P/Es matter in any environment – but especially one like we are seeing today. We will let the speculators mess around with the exciting stuff. We just want to make money in the good times – and protect it in the bad. And it is not a bad time…yet.
Sincerely,