
We did it! We made it through July and – largely speaking – the market and the economy are in one piece. As we have discussed in several past memos – stretching back to early June – we anticipated July would be a month when the “rubber would hit the road”. The question was whether that news would be positive or negative regarding the expectations that were being placed on it by the market and economic “experts”.
So, this week we are going to do a quick recap of the memo we sent you on June 29 – titled “Great Expectations” – and see how we fared. In that memo, we pulled five key data points out of the mix: earnings, unemployment, PMI, retail sales, and GDP. We are going to run through our commentary at the time and see just where we ended up.
Earnings
As we said in June, this is the “most important result” as it relates to the stock market. We have a very clear view of the situation today as 63% of S&P 500 companies have reported earnings. A couple of important points:
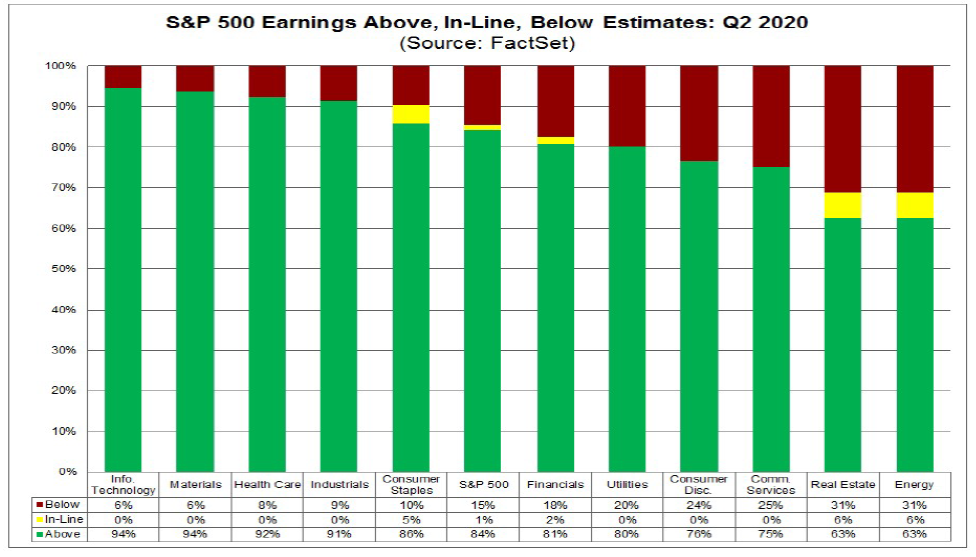
Earnings Surprise
It is no surprise the analysts were particularly negative coming into earnings season. The end results – while not pretty – showed that 84% of the companies that reported in July “surprised” to the upside. That is the highest number of surprises since 2008. If it holds, it will set a break the current record set in 2018 (81%). It should be noted that only 1% of companies reported earnings in line with the “experts” expectations. Sometimes being an equity analyst is a bit like being a meteorologist!
Source: Factset
Past performance is not indicative of future results
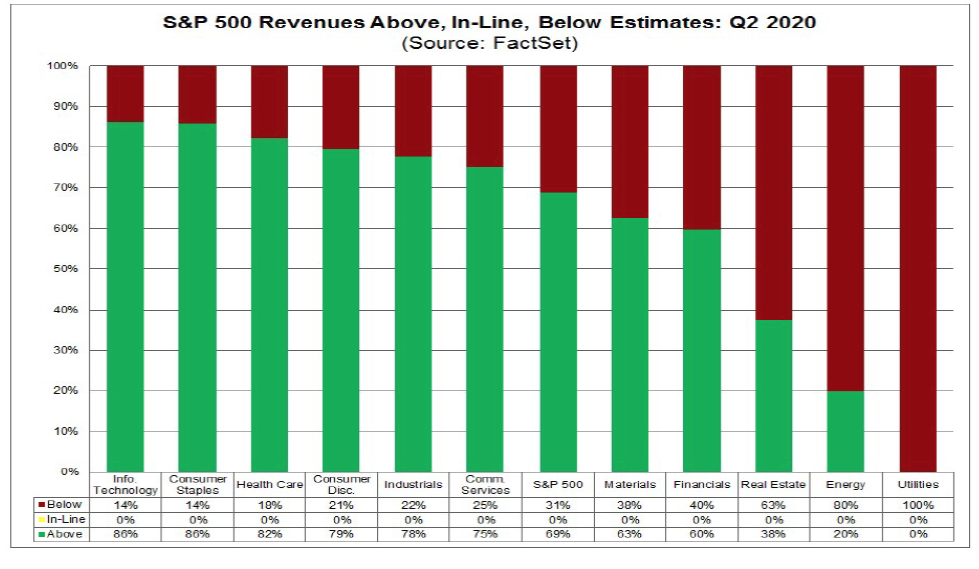
Revenue Surprise
As one would suspect when earnings surprise to the upside, revenues did as well. As of today, 69% of companies have exceed their earnings expectations which sits well above the 5-year average.
Source: Factset
Past performance is not indicative of future results
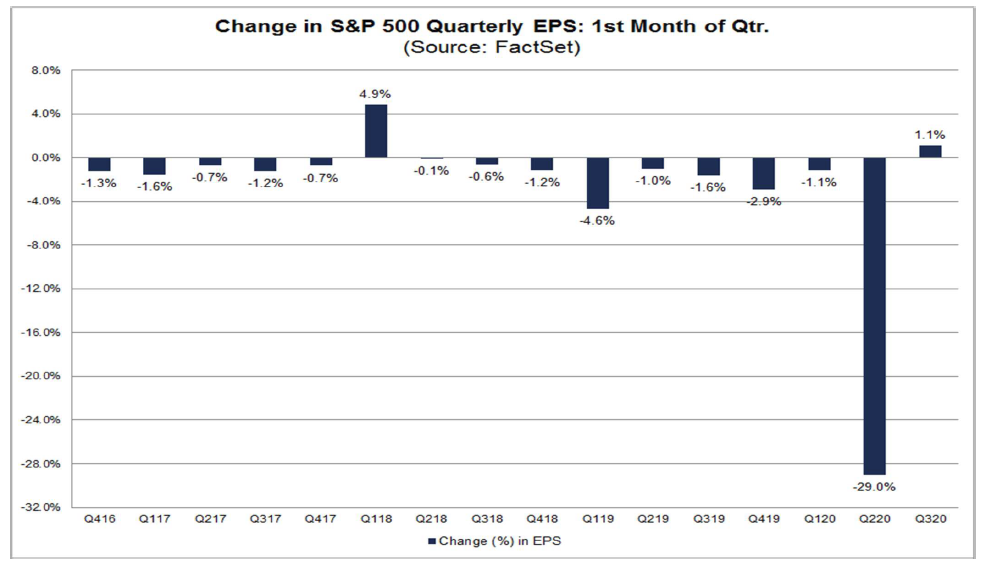
Future Expectations
We are about to get a bit in the weeds here, but we believe this helps explain how Wall Street is looking at the current market. One of the things we track through sources like FactSet is change in quarterly earnings expectations as the quarter progresses. Historically it is very rare for analysts to boost their earnings expectations in the first month of a quarter – even in good economic times. In fact, over the last 15 years (60 quarters), the average change in analysts’ expectations is down 2.4%. In July, however, the change was positive 1.1%.
Source: Factset
Past performance is not indicative of future results
Forward P/E Ratio
One of the big fundamentals we focus on is how “expensive” the market is relative to “future”, or expected, earnings. Frankly, this is an area that has been concerning to us as the market recovered in April and May. With earnings expectations as low as they were, and the market recovering as quickly as it did, the market was trading at a forward P/E of higher than 25x. Given the long-term historical average is roughly 18x in times with current inflation as we are seeing today, that is a bit rich in our minds.
There are two ways to fix a high P/E – either the price (P) must come down, or the earnings (E) must go up. Right now, we are getting the latter. When you combine the relatively stalled out price of the market and the increase in earnings, we have now brought the P/E down to 22.0. We will be watching this closely over the coming weeks.
The Game’s Not Done Yet
While we have seen the majority of earnings reports – there are still some bogies out there to pay attention to. For example, Disney (DIS) reports later this week. We can only imagine the damage done to the company (closed theme parks, closed movie theatres, no live sports (ESPN), etc.) caused by COVID. A particularly bad report in a company of this size and stature can still move the market on a day-to-day basis.
Unemployment
The June unemployment figure was one of the first hard data points we got when it came out on July 2nd. You may recall that this report came on the heels of a May jobs report that was a huge surprise (analysts only missed the real number by 10 million jobs).
In our memo on June 28th, we commented that “we do not expect such a positive surprise” in the June report. We were happy to be wrong. The expectation was 3.0 million jobs gained – the reality was closer to 4.8 million jobs gained. Simply put, the environment we are in today is not lining up with any analytical models, so these “expectations” are really just shots in the dark.
We will see how it all stacks up when we see the July figures on Friday of this week. The current expectation is that we will add 1.65 million jobs and unemployment levels will go down to 10.5%. That would be good news indeed.
ISM Non-Manufacturing PMI
When we discussed non-manufacturing PMI last month, we pushed it forward as one of the “great examples” of the expectations theory. The consensus was it would come in at 48.2 – still in contraction territory. We surmised that, even if it came in at 48.3 “that would mean the service sector is “still contracting but would be considered good news because it would be shrinking less than expected”.
In the end, it seemed the service sector did not want to leave any doubt about things and came in at a shockingly high number of 57.1. The expectation this month is things will continue to hold in the “expansion” territory with a number around 55.0.
Retail Sales
Finally, one where the “experts” were close! Retail sales growth in July came in at 7.5%, slightly below the expectation of 8%. Given the huge 17.7% growth in the May report, this was still seen as a solid number. The July expectation is a bit lower, coming in at 1.4%.
GDP
As we said in June, this is the “granddaddy of them all – considered by many to be the total measure of economic health”. At the time, the consensus estimate was very bad – down 35.3% – and basically remained there throughout the month of July. The final number – which we learned on Thursday – was better than expected, but not by much. It ended up coming in at -32.9% making it the biggest single quarter decline since we started tracking GDP in 1947.
Per pretty much every estimate – that was the bottom of this particularly bad curve. Expectations for Q3 are that our GDP will rise roughly 18% in Q3. There is a broad range of estimates, ranging from up 8% to up 29%. That range will narrow as we work our way through the quarter.
Where does this leave us?
Broadly – the economy and the market won the expectations game in July. As we said before the month started, bad surprises would have been very negative on the market. That did not happen and, right now, we are still in the fight.
Our long-term outlook, then, remains largely as it has been for the past few weeks. The risk level for August – as we know it today – should be lower than what we experienced in July. Then things will get sporty again as we get into September and October before the election.
We would, however, emphasize the “should” in that previous paragraph. We are still waiting for Congress to get past their internecine battles and figure out what the next phase of COVID stimulus looks like. If they head off to recess (already delayed) without a decision, we expect the market to respond negatively. To be blunt, we have seen a lot of talk, but very little real action so far. As usually happens, we would expect a bill to come together very quickly – but we really cannot yet say when that will happen. It will be a focus of the market this week.
We are going to spend the next few weeks talking about some of the other issues important to portfolios and financial planning. Next week – where is the real estate market going to land? If you have any thoughts on topics you are curious about, we would appreciate your ideas as well!
Sincerely,