
Well, we can all exhale now. Last week’s inauguration, while not without drama, passed without any of the nightmare scenarios propagated online and in the media since the Capitol insurrection on January 6th. We are not naïve enough to believe the inauguration of our 46th President, Joseph R. Biden, is the magic elixir which will change the divisiveness and conflict in America today. But it is a very important reminder of the most American tradition of all: the peaceful transfer of executive power.
So, while all is not “hunky-dory”, we can start focusing on what is to come, not the political turmoil. Like it or not, the teams are set for the next two years. Now we need to consider what plans the new administration has and how they could impact your portfolio.
First 100 Days: More Stimulus
When you think about it, the idea that the first 100 days of an Administration are important is a strange one. A President’s term lasts 1,461 days (2,922 if reelected), so the first 100 days is a very brief period of time.
The tradition of trying to move the ball quickly in this period comes from President Franklin D. Roosevelt, who in 1933 made it clear he intended to move the ball quickly to recover from the existing economic turmoil. And move he did. He signed 76 new laws in his first 100 days – the most of any President.
Since his first term, Presidents have learned they have a limited period of political balance to get important policies implemented. JFK executed the Bay of Pigs invasion just 87 days into his term. Reagan moved quickly to free the Iranian hostages. George W. Bush used the first 100 days to pass significant education legislation.
President Biden is clearly intending to do the same. He signed nearly 30 executive orders in his first few days. He is moving swiftly to implement a muscular federal response to the COVID pandemic. And he is pushing hard for $1.9 trillion in additional stimulus aid for the nation.
The proposed new stimulus is significant – and it adds to what has already been one of the most significant federal pushes to support the economy in history. As the chart below shows, the fiscal response – if you include the current proposal – would be nearly double the response we saw to the 2008 financial crisis and has happened much more quickly.
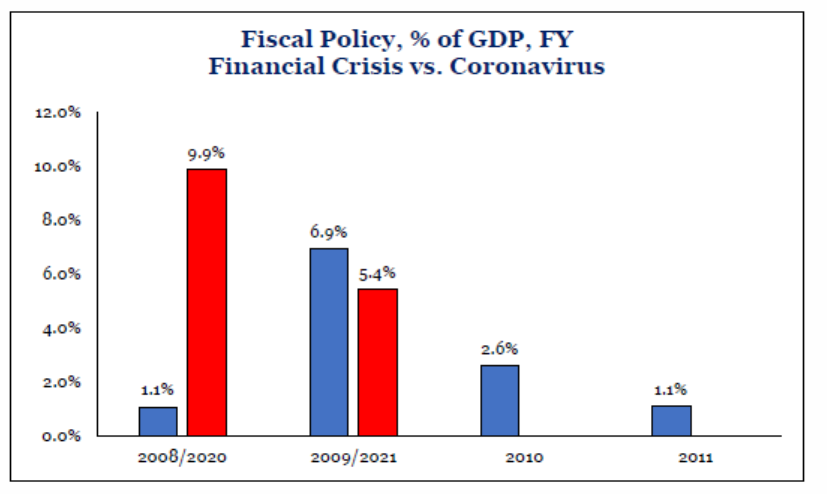
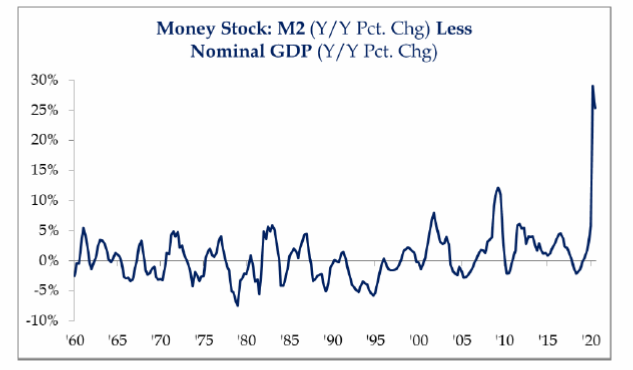
That chart also misses another BIG piece of the stimulus puzzle: the monetary response by the Fed. They are flooding the zone with cash right now. As we discussed last week, the piper will eventually have to be paid (via inflation, interest rate increases, etc.). But we are not there yet.
Past performance is not indicative of future results
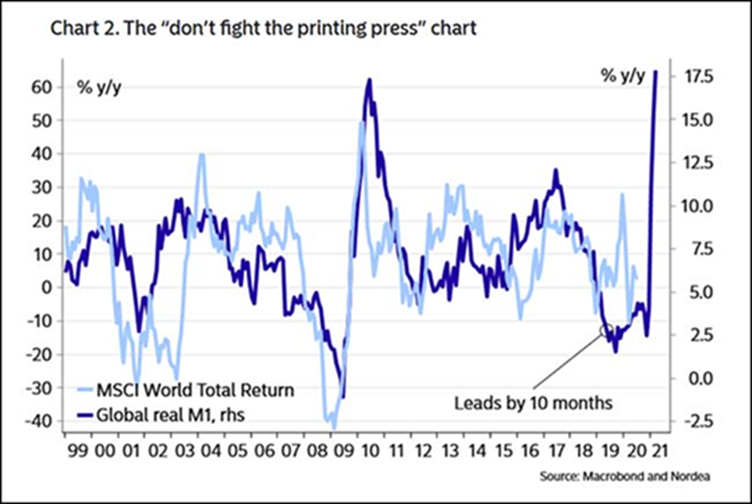
What we know is that this type of fiscal and – especially – monetary policy response is historically very good for equity markets. As the chart says: “don’t fight the printing press”.
Past performance is not indicative of future results
It remains to be seen how successful the Biden Administration and Democrats on Capitol Hill will be in getting this across the finish line. We would expect there is some version of this getting through even if it is not the whole package. The market will be paying close attention and – while it should be good long-term – we would expect some volatility in the meantime as the legislative sausage is made.
Earnings Update
We have got to be honest: it feels good to be spending more time reading earnings reports than worrying about the rest of this stuff. And it is even better when the reports we are getting continue to look positive.
So far 13% of S&P 500 companies have reported earnings through Friday. 86% of those companies have reported a positive earnings surprise. You may remember us citing a similar number last quarter noting it would have set a record. Yet again, if the surprise remains at this level, we will set another new record. Right now, we are on pace for an earnings loss of 4.7%, but if we keep getting surprises at this rate, it is quite possible Q4 will end up with positive year-over-year earnings. That is something we have not seen since Q4 of 2019.
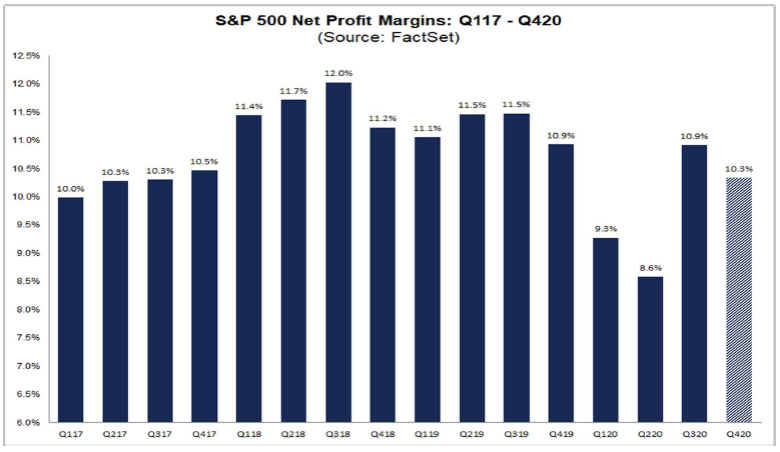
Earnings are one thing, but profit is important as well. As FactSet pointed out on Friday, we are on pace for a 10.3% net profit margin in the S&P 500 for Q4, the first time we have had 10%+ numbers in consecutive quarters since 2019.
Past performance is not indicative of future results
Current estimates for 2021 are even better with estimates for the first 3 quarters at 10.6%, 11.1% and 11.6% respectively.
The Rally Is Started to Widen
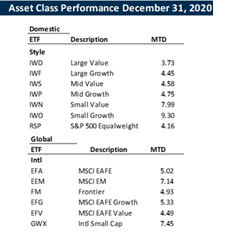
One of the problems with the rally since the correction last March has been – in our opinion – how narrow it was. Yes, the back half of the year was great for equities. But, as you have heard us say before, that was largely due to the “FANMAG” stocks. If you take them out of the mix, the performance for the rest of the S&P 494 was less than half that of the overall index. Those six companies amounted for 52.5% of the index performance last year. The other 494: only 47.5%.
That started to change in December. Yes, large cap growth (where the FANMAGs reside) had another good month. But it was outpaced by both mid-cap and small-cap (both growth and value) and international stocks.
Past performance is not indicative of future results
There are no guarantees this trend continues, but the weakening dollar and a strengthening economy should continue to drive the areas of the market that struggled last year. There is certainly room for these positions to grow and it should be an opportunity in portfolios.
Sincerely,