
The Weekly Insight Podcast – And So It Begins
Last week was full of opportunities to move the market. Chairman Powell spent two days on Capitol Hill testifying in front of Congress and confirmed the market’s expectations of rate cuts later this year. The latest jobs report came out showing more new jobs last month than expected. But it also showed a rising unemployment rate meaning more people are looking for jobs. And wage growth – still at much higher levels than we’ve seen the past two decades, continued to slow, dropping from 4.4% to 4.3%. All in all, a good week for the economy.
But while Powell led the economic news in Washington this week, it was the political news that really mattered. It’s official: the general election campaign for the White House has begun. Former President Trump continued his primary domination on Super Tuesday, causing his last true rival, Nikki Haley, to withdraw from the race. And President Biden rang in the new election season with a very pointed State of the Union address.
The truth is, very few Americans are excited about this campaign. In 2016, Trump and Hillary Clinton set the record for the least liked candidates ever to run for President. In August of that year, 56% of voters had an unfavorable view of Senator Clinton and 63% of voters held the same view of President Trump. Today it’s not much better. 56% of voters disapprove of President Biden and 53% of voters disapprove of President Trump. By the time it’s over, they may just set a new record of undesirability.
So, it’s likely you aren’t too excited to hear us ramble on about this election. You won’t hear us talking about the benefits of one candidate or the other. But the impact of elections on the market matters. Let’s take a look.
Importance of Presidential Election Years
We’ve talked in the past about the significant historical basis for an assumption that Presidential election years have been broadly positive for the market. In fact, there have been just four presidential election years since 1924 (1932, 1940, 2000, and 2008) in which the market has had a negative return. And each of those years has seen significant economic headwinds.
There are – at least now – no such headwinds. The economy is chugging along nicely, and we don’t have the valuation problems which we saw in 2000 (except for the Magnificent 7). Barring a major misstep by the Fed on interest rates, our outlook on the economy for 2024 is neutral to positive.
But while the trends are positive for election years, they get even more interesting when we look at years in which an incumbent President is running for reelection. Returns have averaged 15.8% (vs. 11.2% for all Presidential election years).
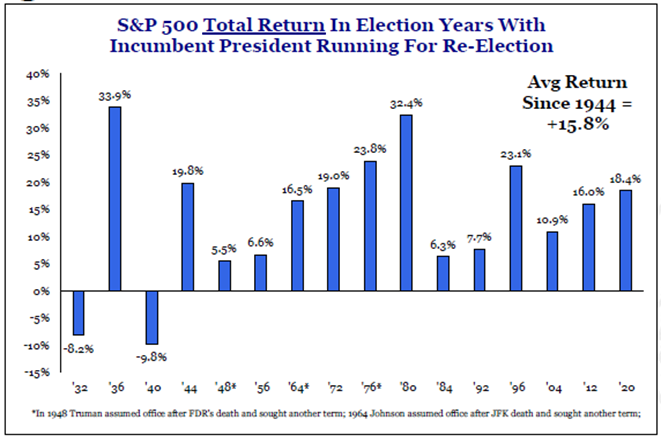
Past performance is not indicative of future results.
Why would reelection years have such a significantly different outcome than years with no incumbent? The Power of the Presidency. It should come as no surprise that the occupant of the White House, no matter the party, will inevitably use the power of their office to help impact the outcome of the election. And this is most successful when using their office to juice the economy. That’s good for markets.
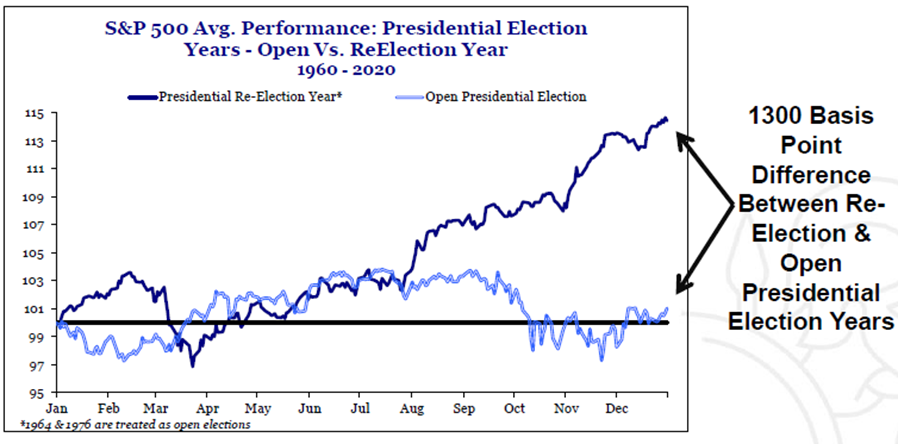
It’s also notable that re-election years tend to be the most “certain” of election years. Incumbent Presidents are either popular or they’re not. The result of the election tends to be well understood by the time we get to the end of summer. That’s why we see the market begin to rally the closer we get to election day. Markets love certainty.
What Does This Mean for Trump v. Biden
There is no doubt this election will be one of the…weirdest…we’ve experienced in some time. In fact, it’s just the second time in history that two Presidents have run against each other. The previous instance was the 1892 campaign between Grover Cleveland and Benjamin Harrison. Harrison defeated an incumbent Cleveland in 1888, but Cleveland returned to defeat Harrison in 1892.
While that history isn’t predictive of the outcome, we can say that the level of certainty that has driven markets in the closing months of a typical reelection year is not likely this year. It is much more likely this will be a close, down-to-the-wire election.
You should be used to that by now. Close elections have been much more common since the turn of the century than blowouts. And those close elections have painted a much different picture for market returns in election years since 2000.
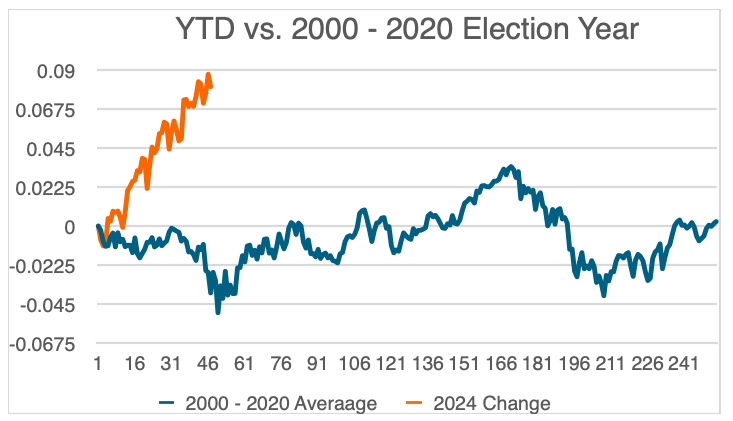
Source: www.YCharts.com
Past performance is not indicative of future results.
Obviously, the start to this year is much better than we’ve seen since 2000. But the point we’d draw you to is the volatility that exists as we get closer to election day. As you can see above, there tends to be a significant spike in the market around trading day 150 (roughly early July) which lasts approximately one month. Then there is a quick reversal from August through early-to-mid October. It is only once the market gets a sense of what the result will be that it starts to rally back to positive territory.
In the end, the victor of this election won’t have a significant impact on the markets. We’ve seen in both the Trump years and the Biden years that we can make money in the markets. The question for this election year is about when we will see certainty about the eventual victor. The less certainty there is, the more volatility we can expect in late summer and into the fall. It will be important we remember why we’re seeing election year volatility if it happens. It doesn’t have to be the end of the world and may present opportunities for us in trading portfolios.
Sincerely,