
The Weekly Insight Podcast – What’s the Deal with NVIDIA?
In last week’s memo, we included a chart from a tweet we saw that blew more than a few of our readers away. Let’s look at it again.
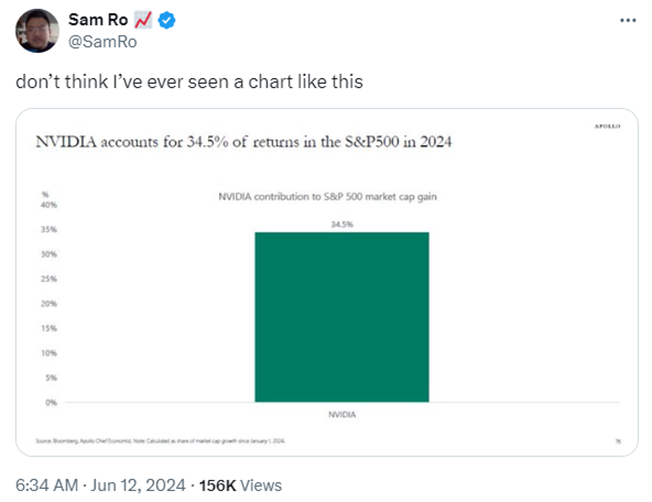
That’s right, as of a few weeks ago, NVIDIA had made up more than 1/3 of the S&P 500’s performance. But it gets worse than that. Per the Wall Street Journal on Friday, NVDIA has made up 44% of the market’s return since the start of 2022. Microsoft, the other “AI Giant” has accounted for 14%. That means just two companies have made up 55% of the total return of the market for nearly 18 months.
Past performance is not indicative of future results.
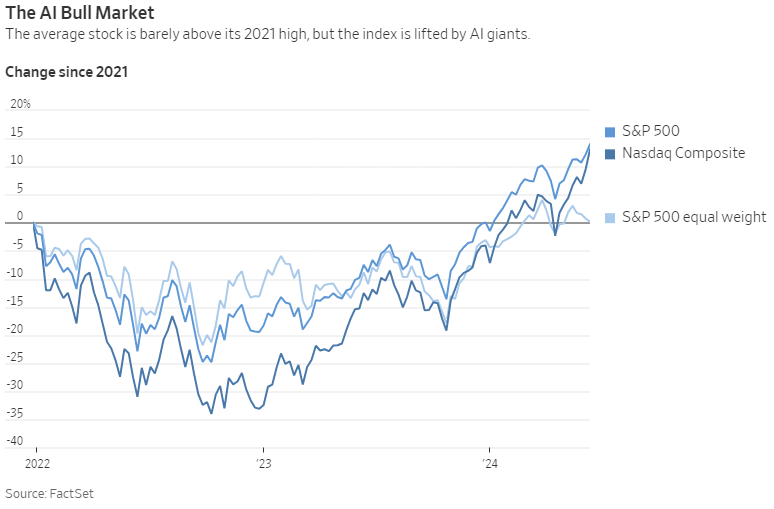
In fact, it’s even worse if you look past the top 500 companies and instead look at the Russell 2000. That index is still down more than 10% from its 2021 highs. Right now, the stock market is NVIDIA and Microsoft. And that’s about it.
So, what is it about NVIDIA that has caused the shares to be up 700% in the last two years? What has moved them from a Jim Cramer talking point to the second largest company in the S&P 500? And how worried should we be that any cracks in their armor will be a problem for the broader market? Let’s take a look.
Why NVIDIA?
We’ve all heard the line by now: NVIDIA is the leader in making microchips for Artificial Intelligence. But why? What makes them special versus other competitors?
NVIDIA has been around for a long time. They were making chips in the 1990s focused on graphics. They weren’t particularly large or special, but they survived the Dot Com bust, which thinned out the competition. And video game players loved their chips which provided the revenue necessary to look to expand the business into other – non-graphics – areas.
Then came the rise of cryptocurrency mining. The demand for Bitcoin meant people needed chips. A lot of them. And NVIDIA was able to provide them. But during this time, they were spending a significant amount of their energy and resources on developing chips specifically designed for machine learning/artificial intelligence. This meant that as the AI game started to gather steam, NVIDIA was ready to go while others were playing catch up.
That scale has also meant they’ve been able to build a competitive moat around their company. There are a lot of firms trying to build AI chips right now. Amazon, AMD, Intel, IBM, Google. You name it, they’re all doing it. But after they design the chips, someone must make them, right?
That someone is Taiwan Semiconductor Manufacturing Company (TSMC). TSMC makes 90% of the semiconductor chips made today. 90%. It’s an unbelievable number (and the reason China wants to take back Taiwan!).
Apple is TSMCs largest customer – but they’re not building AI chips and they’re not selling their chips to other customers.
NVIDIA is the second largest customer and the largest AI chip customer. So, can you imagine who gets priority when their orders come through? You guessed it: NVIDIA. Their chips get made first. Which means they have a heck of a competitive advantage.
NVIDIA has built a heck of a product and has cornered the market in both production and sales of the most in-demand sector in computing today. Hats off to their CEO and co-founder Jensen Huang. He nailed it and there is a reason the stock has surged.
Is This the Next Tech Bubble?
You’ve seen this tale play out a million times: an innovative technology grabs the attention of investors, and they overcommit to the investment. It was the heart of the tech bubble in the late 1990’s. Is it the fate of NVIDIA? Maybe.
The first thing we must remember about the tech bubble is that a huge majority of the companies that “boomed” never had any revenue! That’s not the case for NVIDIA. They’re making money. Their net income has been north of $1 billion since 2017 and last year jumped from $4.4 billion to $29.8 billion. That is a huge differentiator from the Pet.com’s of the late 1990s.
But that doesn’t change the fact that the market can massively overreact to companies with such positive moves. Which is why NVIDIA’s price-to-earnings ratio of 74.06x, or their price-to-sales ratio of 39.57x is concerning.
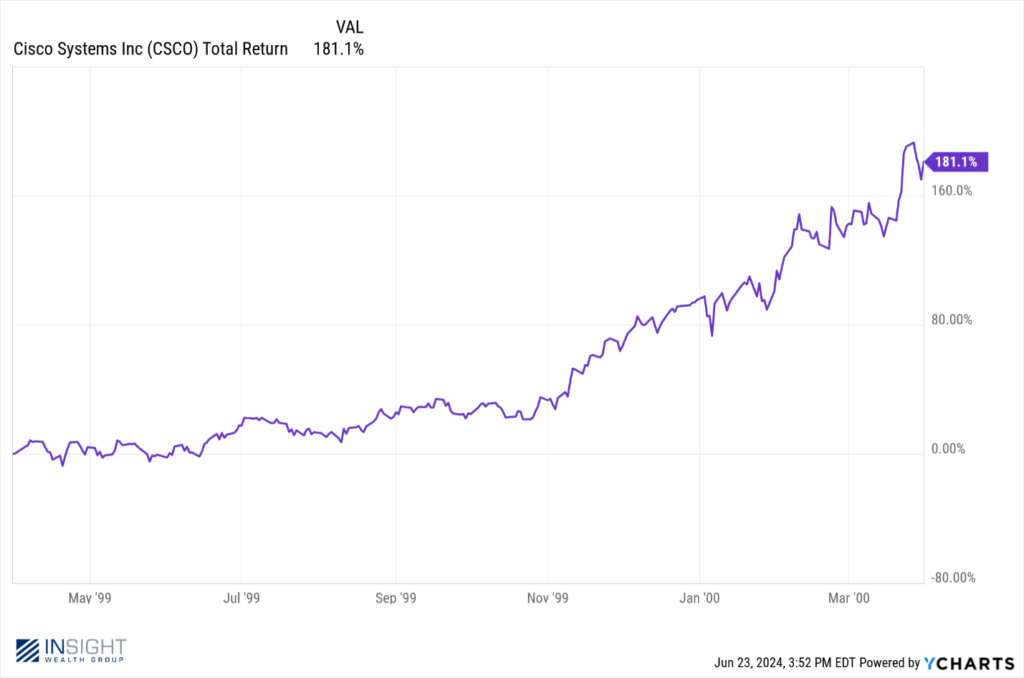
We’ve seen this before. During the tech bubble there were some really stupid bets happening. But there were also some good companies getting caught up in the wave. Take, for example, this chart of Cisco Systems (CSCO) from March 31, 1999, to March 31, 2000.
Past performance is not indicative of future results.
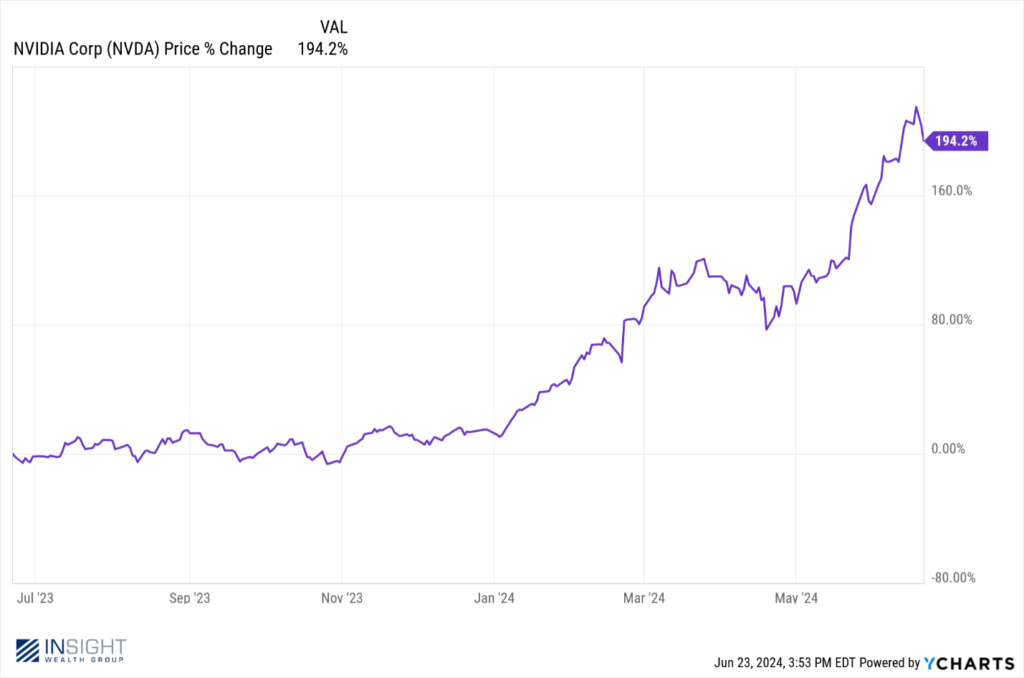
It looks a lot like this chart of the last year for NVIDIA.
Past performance is not indicative of future results.
Yes, we’re aware there is zero correlation between these two companies and their returns 24 years apart. But it’s important to remember the position that CSCO was in back in 1999. It was a good company with solid earnings. In 1999 they had revenue of $12.15 billion. That would be about $22 billion in today’s dollars and would make for the 13th highest revenue in the S&P 500 today. Right now, NVIDIA is 8th on that list with $42 billion in revenue.
Back in March of 2000, CSCO’s P/E ratio was insane. It was 196.2x earnings (which makes NVIDIA seem like a steal at 76x!). The pop that came for CSCO when the tech bubble burst was, not surprisingly, drastic.

Past performance is not indicative of future results.
Here’s the thing: CSCO didn’t stop being a profitable company on March 31, 2000. In fact, they’ve had revenue north of $48 billion for each of the last eight years. But, if you were that poor investor that bought the stock in March of 2000 at $80.25, you’re still down 41% on the position. The problem with CSCO wasn’t the company. It’s the value investors put on the company. The same may be true for NVIDIA.
Does That Mean NVIDIA Is Going to Tank the Market?
This is a big worry of many investors. “Uh-oh. Here it comes”. We’re not so sure of that.
There is a substantial difference between what happened in 2000 and what we’re seeing today. Yes, we have a few exceptionally large companies that have outperformed and have unsustainable valuations. But the rest of the market is much more fairly priced. If you look at the S&P 500 without the “Magnificent 7”, the P/E ratio is closer to 15.5x which is below the long-term historical average.
We also know that narrow rallies (i.e., those led by a few large companies) tend to widen over time. There is some good evidence that will be happening soon.
The Magnificent 7 – led by NVIDIA – has been going through a massive surge in earnings while earnings have slowed in the other 493 companies. But that is about to change. According to FactSet, the earnings of the other 493 companies are expected to surge throughout the rest of the year at the same time we see the Magnificent 7 slow. The broadening is on its way.
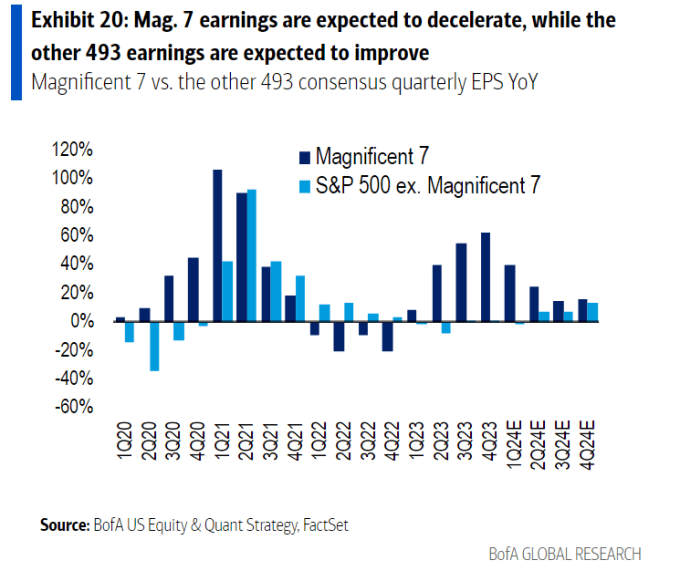
Past performance is not indicative of future results.
So, what do we do? We trust in the wisdom of a diversified portfolio. They’ve worked well in the last few years and should enjoy the fruits of expanded earnings for the rest of the market in the coming months. And we also look forward to the opportunities to buy companies like NVIDIA after the excitement wears off. A buyer of CSCO at the bottom has made over 533% in the last 22 years. We don’t hate 24% annualized returns!

Past performance is not indicative of future results.
Sincerely,