The Weekly Insight Podcast – The Base Case
As we sit down to write this memo, your author has just returned from the 10th Annual Insight FairFest Client Appreciation event at the Iowa State Fair. What started a decade ago as a small gathering of clients has blossomed into a wonderful crowd, growing each and every year. And as we pulled away from the event, all our team could talk about was how grateful we are to have the opportunity to work with such amazing clients. So, to each of you – those who make it every year and those who have not had the chance – thank you. From the bottom of our hearts. We just hope we provide as much value to you as you do to us.
Now – on to the business at hand.
It was inflation week again – something our readers are getting quite used to. But this week also signaled a new era of the inflation conversation that we thought is important to explain and understand. Because – this may seem crazy – inflation is likely to rise in the coming months. And that is not necessarily a horrible thing.
Let’s first go through the data we got last week and then we can get into to the meat of what the future is going to bring.
Consumer Price Inflation (CPI)
We have explained this in detail before, but as a refresher there are two measurements that are reported: all-items CPI (everything) and Core CPI (everything but food and energy). Core is what the Fed is concerned about. All-items is what the consumer is concerned about.
Both ticked up at a rate of 0.2% month-over-month. On a year-over-year basis Core CPI fell from 4.8% to 4.7%. All-items CPI rose from 3.0% to 3.2%. (more on that math later!). The year-over-year results for both categories were slightly better than expected.
Yet again, shelter was the biggest game in town. To quote the Bureau of Labor Statistics release “The index for shelter was by far the largest contributor to the monthly all items increase, accounting for over 90 percent of the increase”.
Our faithful readers know this game by now: the BLS is vastly overrepresenting the rise in the cost of shelter. But it is notable that even their numbers are starting to drop. Here are the monthly changes for the first seven months of the year:

Past performance is not indicative of future results.
What is most notable from the quote above is that shelter was the biggest factor in ALL-ITEMS inflation, not just Core, last month. They are still calculating the year-over-year inflation in shelter at 7.7%. But it has turned the corner and the reduction in this number should be beneficial to overall inflation as time goes along.
Producers Price Inflation (PPI)
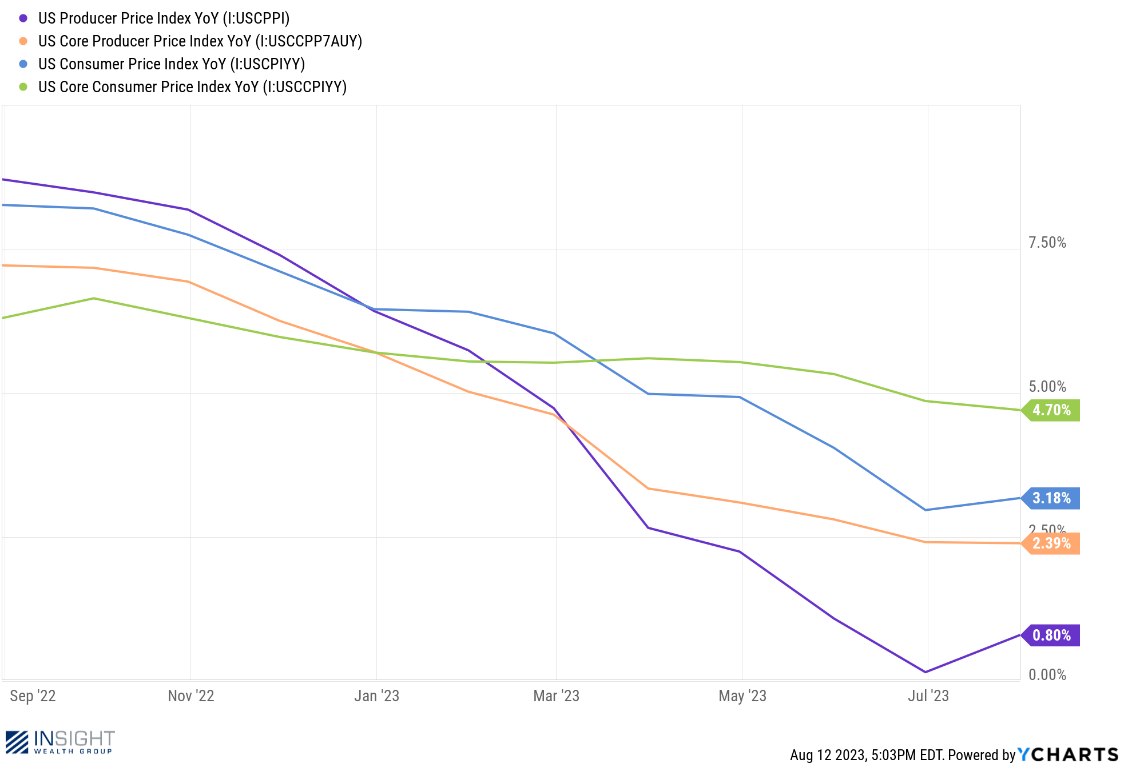
PPI, like CPI, is separated into Core and All-Items. But instead of measuring inflation at the consumer level, it takes a read before prices get to the consumer and measures inflation of input costs to manufacturers, providers of services, etc. Because of this, PPI tends to be a leading indicator of CPI.
As such, we have seen PPI drop much faster than CPI. In fact, last month’s year-over-year PPI came in at just 0.2% (vs. 3% for CPI).
Past performance is not indicative of future results.
But much like CPI, we saw a little jump this month in the numbers. Core PPI grew 0.3% month-over-month (up from -0.1% in June) and 2.4% year-over-year. All-items PPI grew 0.3% month-over-month and 0.8% year-over-year.

Understanding the Base Case
This is where the math comes in and it is important to understand how it works. It will help temper your expectations in the coming months (and will be a big part of the Fed’s calculations when they meet in September).
When we think about inflation there is a big distinction between how “month-over-month” and “year-over-year” calculations work. That leads us to a conversation about the “base case”.
One of the things we had going for us over the last several months was that we were measuring our year-over-year inflation (both PPI and CPI) against the peak inflation we saw last spring and summer. CPI peaked in June of 2022 at 9.0%. As such, the change in year-over-year calculations mean even a particularly bad month-over-month read could still result in a smaller year-over-year inflation calculation.
Take, for example, the February CPI report. CPI grew 0.5% month-over-month. That is, no doubt, much worse than the 0.2% we saw in July. But in February year-over-year CPI actually fell from 6.5% to 6.4%.
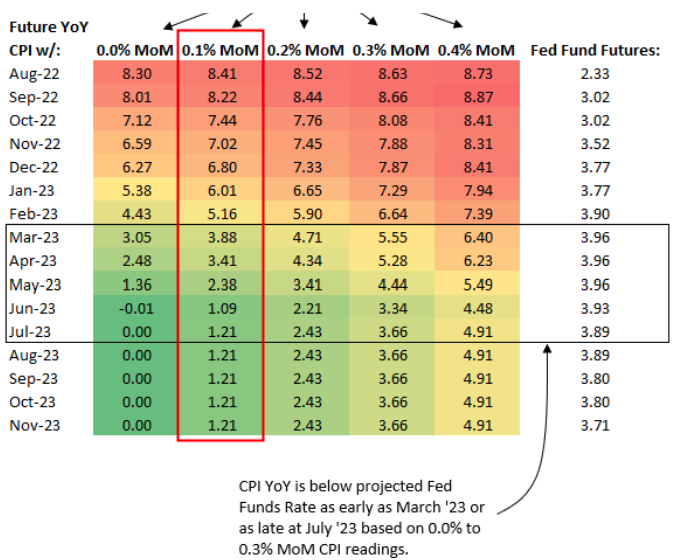
That gets us to a chart we showed you a long time ago at the peak of inflation. This chart, from late last summer, showed the impact of various rates of month-over-month CPI would have on year-over-year inflation. The gist was that, even if we had 0.4% month-over-month inflation for several months, inflation would still be falling. Anything lower would be great. Our 3.2% CPI read from July lines up nicely with the chart.
Past performance is not indicative of future results.
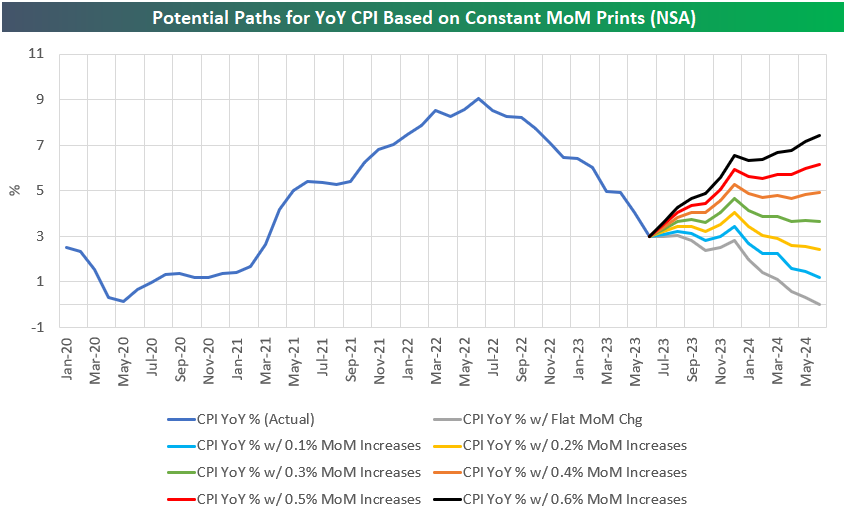
The chart below takes the same information and puts it in a bit more readable format for what is going to happen in the future. Because we are now measuring against falling CPI numbers, even growth rates as low as 0.1% per month are going to result in a tick-up of CPI between now and the end of the year.
Past performance is not indicative of future results.
The good news is the Fed and economists understand this trend in the data. We must get past the wild swings in the base case so we can get into more normalized data. That time period is not far away.
Sincerely,