
Cars have become much more reliable over the years. Consumer Reports says the average life expectancy of a car today is 8 years or 150,000 miles. In the 1970s, car odometers rolled back to zero after hitting 99,999 – because frankly it was not expected that number would be hit. It is a testament to research and design work that has made automobiles safer and more effective.
As cars have become more reliable, you rarely ever see people just “checking under the hood” before a trip. Be honest – how many of you checked the oil in your car before you took off on a weekend road trip? Some certainly did – but not many. We remember well – working on the farm when we grew up – checking the oil on a piece of equipment nearly every day before we used it.
While automobile maintenance has been made “easier” over the years, economic maintenance still requires regular – almost daily – looks “under the hood”. Portfolios cannot afford missing a “check engine light”. That is why our Investment Committee is constantly at work analyzing data to better understand how to position portfolios. And it has been even more important during the time of COVID.
So, this week we are going to broaden the discussion out a bit and take you under the hood with us. We want to show you some of the larger economic issues we are discussing in Committee and how they are impacting the choices we are making in portfolios. It is vitally important to the health and future of your investments.
Optimistic Signs
In 2020 you can find reasons to be negative anywhere you look. Just turn on the news and we can promise you will find something that will make you sad, angry, or scared. The same can be said for the market. Not a day goes by when we do not see an article citing some sort of statistic which “clearly shows an inevitable collapse”.
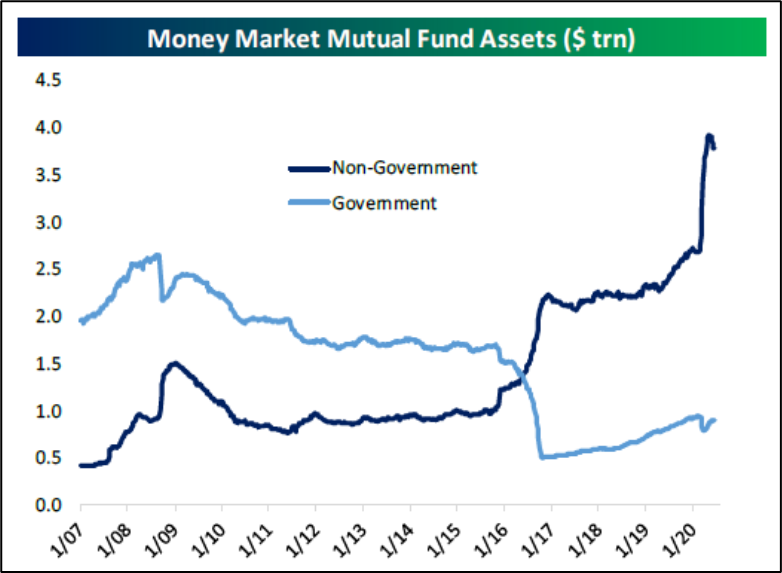
There is no question we must carefully watch for these reasons to be pessimistic (we have a whole section on that later in this memo!). But we also cannot live our lives in fear. As we pointed out in last week’s memo, a massive amount of money left equities and has gone into money market funds over the last year. And every one of those dollars missed one of the largest and quickest market rallies in history.
So, we are going to start this week’s memo with the good news. What are the things that give us optimism in this scary time?
Unprecedented Monetary Response
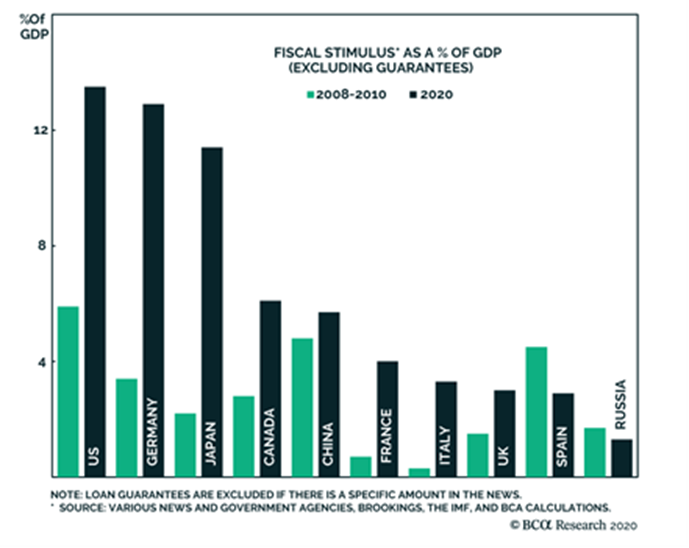
This is one of those that could go in the “optimistic” or “pessimistic” bucket, depending upon your persuasion. The downside to the aggressive monetary and fiscal response to COVID is…well…someone is eventually going to have to pay for it. We will come back to that one later. But in the meantime, as we look at what it means for the economy and the market over the next 1 – 6 months, it is a good thing.
Past performance is not indicative of future results
As you can see from the chart above – there is no comparison to the size of fiscal response governments enacted to battle COVID. We all thought we threw a lot of money at the fiscal crisis in 2008, right? That is barely a drop in the bucket compared to the COVID response.
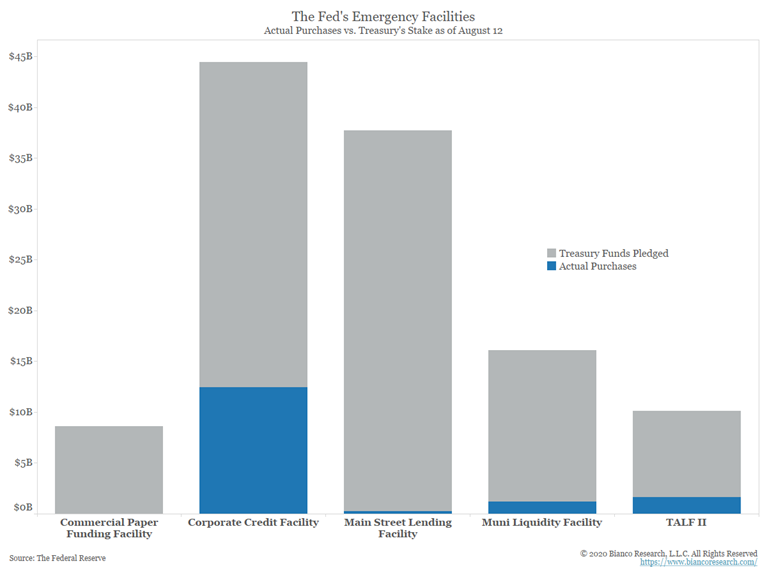
But, more importantly, while the Fed and Treasury can throw a lot of money at this problem (and have!), they also still have a significant amount of dry powder. They have barely tapped some of their key stimulus and lending programs.
Past performance is not indicative of future results
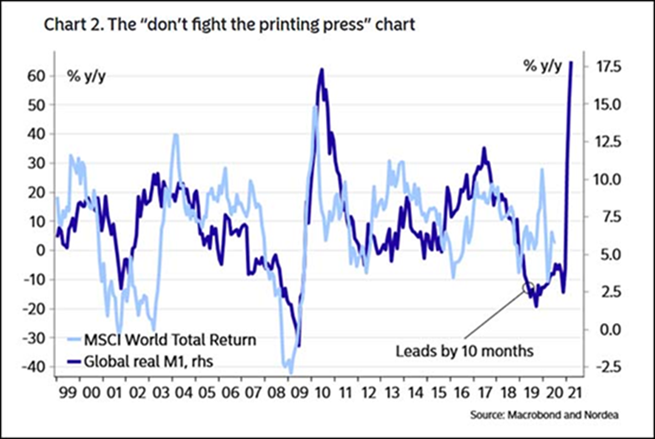
That brings us back to the stock market. It is important to remember the market loves increases in money supply. There is a clear correlation between the performance of the stock market and the global money supply. Actions like we have seen by the Fed and other central banks have been leading indicators for rising stock markets. And the chart below would suggest there is still more juice left in the equities game.
Past performance is not indicative of future results
The Rally has been Very Narrow…but that is Changing
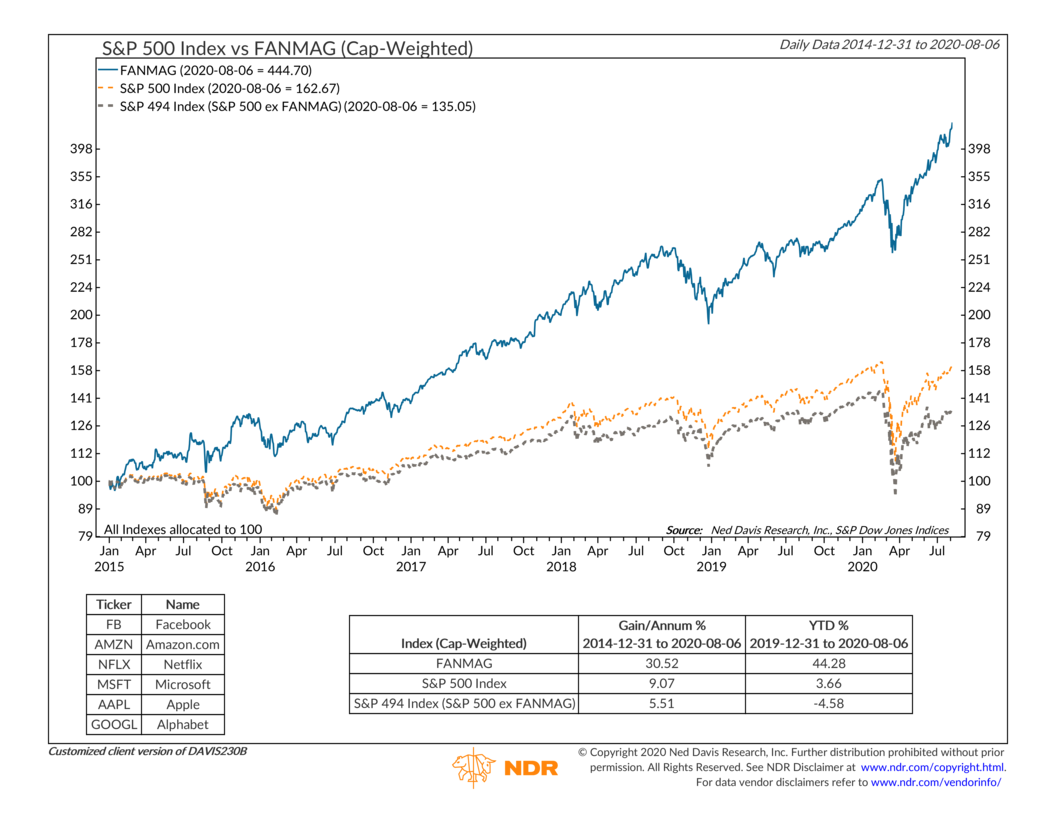
We have beaten this statistic into our readers heads for a long time now, so we will not belabor the point. But it is important to remember that this rally has been carried by just a few names. If you take out the “FANMAGs” from the S&P 500, the index would still be negative for the year. Those six stocks have added an additional 8.24% to the performance of the index through August 8th.
Past performance is not indicative of future results
But that is starting to change. While tech and large growth (i.e. the FANMAGs) are still having a good month, the market is actually being driven by other areas – particularly Small Cap, Consumer Discretionaries, Industrials and – FINALLY – international stocks. We need other areas of the market to begin to carry the load if this recovery is going to continue.
Which brings us back to the most important point from last week’s memo – as the rally starts to widen, there is still a tremendous amount of dry powder left on the sidelines. If interest rates continue to remain unnaturally low (as we expect they will for some time), the equity markets become the natural place for investors to send money.
Past performance is not indicative of future results
Pessimistic Signs
As we said above – you do not have to look far to find reasons to be pessimistic in 2020. That seems to be the natural state of being today. But beyond the general feeling of unease, we are looking for hard, factual reasons to doubt the ongoing recovery and market rally. There are a few and they will be a big part of our decision-making process as we get into the fall.
Markets Hate Uncertainty (Political Version)
You have heard us say this a lot in these pages – but the stock market would rather know bad news is coming than be unsure if bad news is coming. That is a frequent cause of negative volatility in the market. Just think back to the Brexit example: the market crashed almost immediately after the British people voted for Brexit. The crash was not because of the policies (know one knew what they would be!) but was because of the uncertainty into which the European continent was thrown.
When it comes to volatility in an election year, the market would really prefer to know who the victor will be – even if that victor may end up having a negative impact on the market. What that means today is it would be better if one of the candidates just won by about 25%. A close election – especially one that is challenged or delegitimized at the end, could have negative consequences.
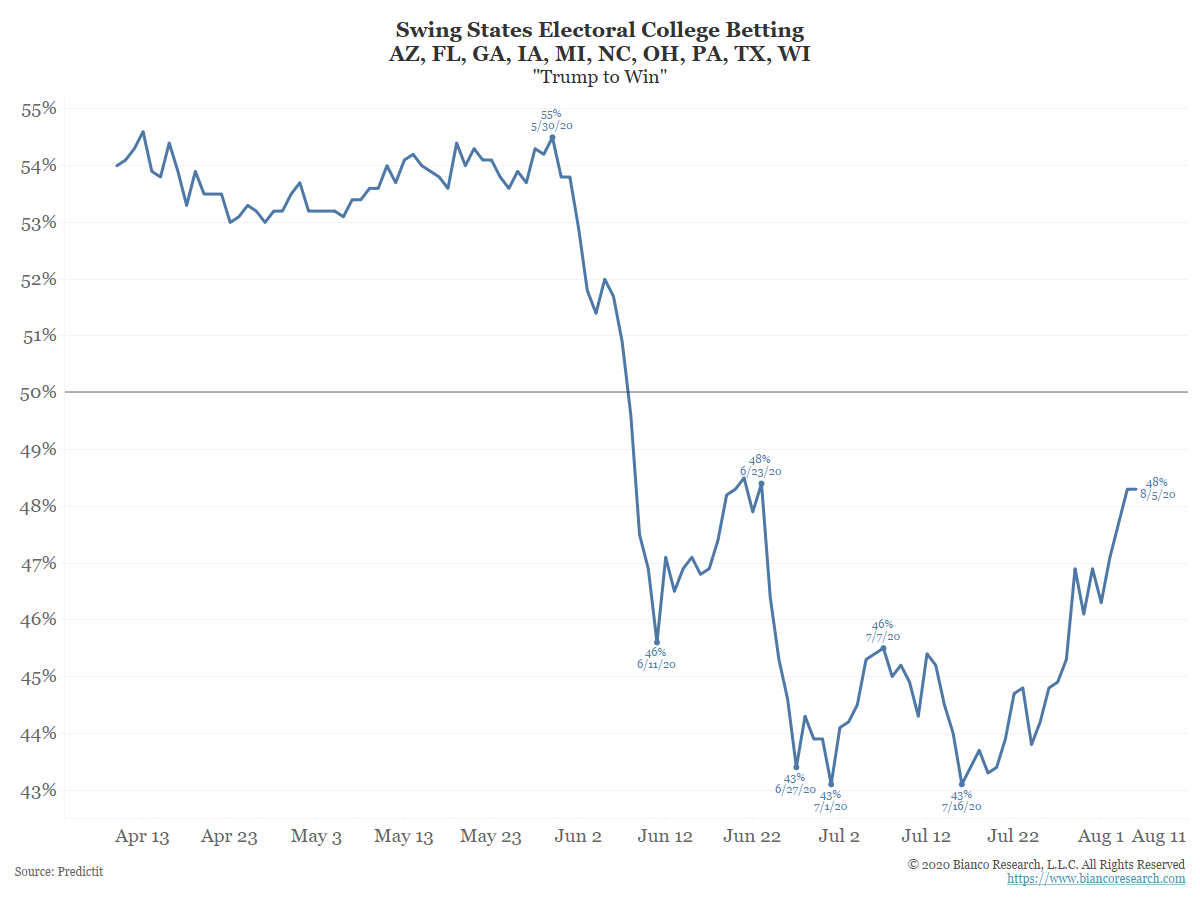
Which brings us to today. Yes, Joe Biden is leading in the national polls. But we have seen a distinct change since late July in the “battleground” states. Trumps numbers are improving.
Past performance is not indicative of future results
Whichever side of the aisle you fall on – the closer those numbers get to 50/50 – the less certainty the market has about who is victorious. And the more uncertainty there is – the more volatile things will become.
Rising Taxes?
We still intend to do a more thorough review of the candidates’ positions in the coming weeks. But this is an issue we want to drill into as it may become a significant factor in market performance as we get past the election and closer to the end of the year.
For this example, let us assume the “Trump Tax Plan” is the status quo. He has talked recently about additional payroll tax cuts – and has used executive authority to implement a deferral of some payroll taxes through the end of the year. But there is not an expectation that he intends to, or could, implement additional significant tax policy changes in the current environment.
The Biden tax plan, however, is something to which we should pay close attention. Admittedly, the assumption we are making here is that Biden would win, and he would have support in both houses of Congress to pass his plan. That is far from guaranteed. But what is the plan?
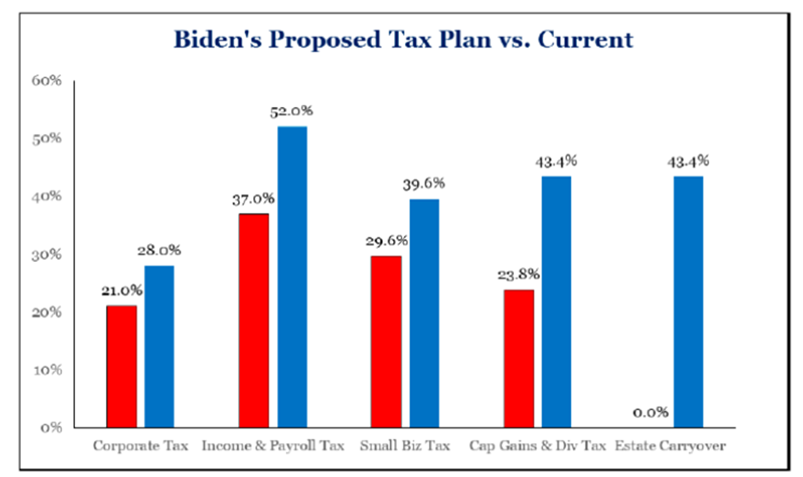
Simply put, it includes significant tax increases to corporations, small businesses, top individual taxpayers, and the estate tax. But, probably most important to the discussion of Q4 equity performance, it also includes a potentially massive increase in the capital gains tax rate moving it from a top level of 23.8% (20% + a 3.8% Medicare surcharge) to bringing it in line with the taxpayers income tax rate. That means capital gains could be taxed as much as 43.4%.
Past performance is not indicative of future results
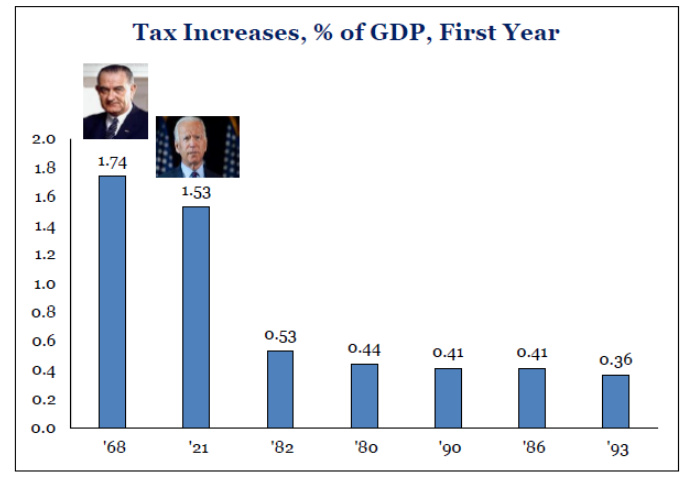
If implemented, this would be the 2nd largest tax increase – as a % of GDP – since the increase implemented by President Johnson to pay for the “Great Society” programs in 1968.
Past performance is not indicative of future results
If the 1968 example is our guide, it was very bad for equities markets as you can see from the chart below.
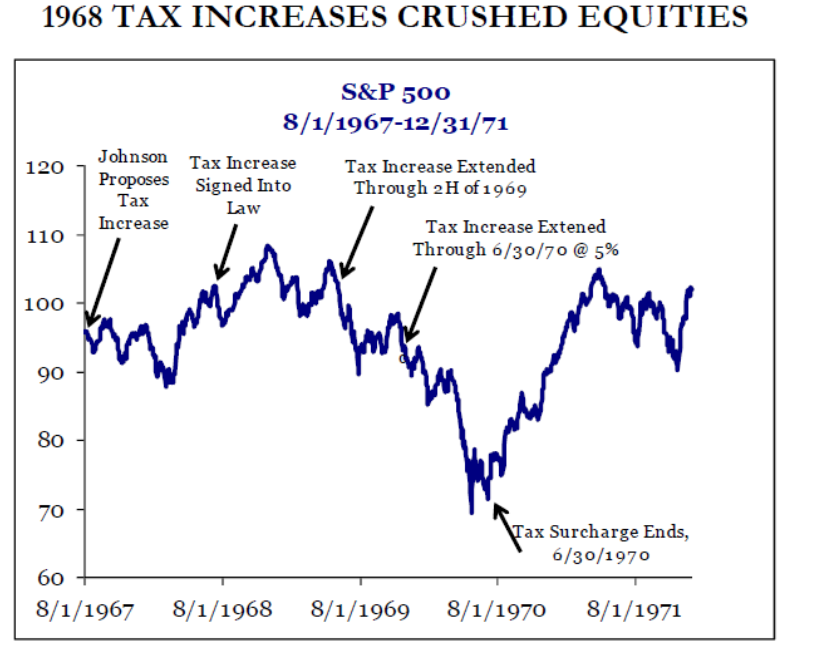
Past performance is not indicative of future results
In the short-term, however, we are much more worried about the mechanics of the capital gains tax increase. If Biden were to win, and the Democrats gain control of both houses of Congress, we would assume this will be one of the “easier” pieces of the tax bill to pass. While it would impact nearly all our clients, it would not be unpopular with most Americans who are unimpacted by capital gains rates.
So, assuming easy passage, there is a pretty direct line to draw between an election victory in November and market participants deciding to harvest their gains – at the current tax rates – before the new rate could be implemented in 2021. That could potentially mean tremendous volatility over the last two months of the year.
Debt, debt, and more debt
We could not possibly count the number of times our clients have asked this question: “How long can the current “easy money” environment continue until we finally have to pay the piper?”
It is the right question to be asking. Debt levels have absolutely exploded and now sit at the highest levels since World War II.
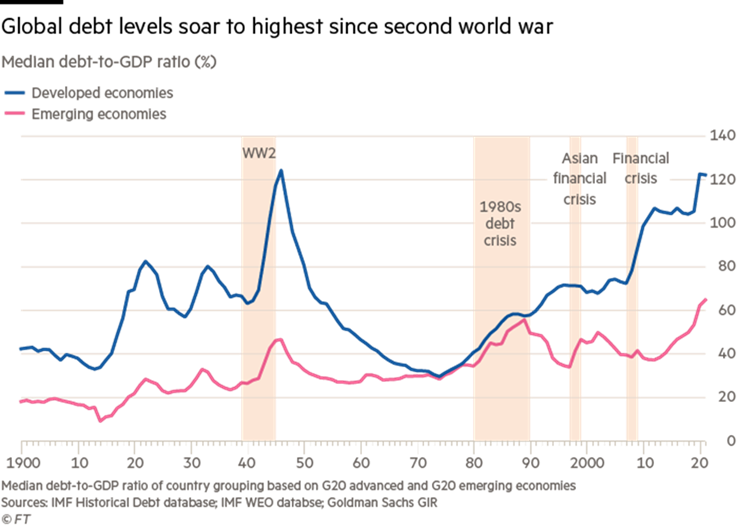
Past performance is not indicative of future results
This is not a, however, a 2020 problem. Well…it is in the sense that we are stacking debt up like cordwood right now. But the chicken is not coming home to roost this year. Understanding the endgame here will be one of our biggest priorities over the next several years, but not much will change until the Fed changes its posture.
Short-, Mid-, and Long-Term Outlook
What all the above data tells us is this:
- In the short-term (next 30 days), equity markets have the potential to continue to outperform as there is very little else that can provide value in this environment.
- In the mid-term (Q4), equity markets will likely still be the place to be…in principal. But the impact of the election – and its potential policy implications – could outweigh the technical drivers for the market.
- In the long-term (2021 & Beyond), good luck! Our crystal ball does not quite reach that far at this point. We will be watching the election, continued COVID recovery and interest rate policy to determine the best path forward.
As always, we would appreciate your feed back on our thoughts here. Intellectual honesty requires us to admit we do not have all the answers and the feedback we get from each of you is a big driver in our thinking. We are blessed with smart clients and readers and we learn as much or more from you than we do from charts and graphs. Your input is vital!
We hope this finds you well. We look forward to talking with each of you soon!
Sincerely,