
The Weekly Insight Podcast – A Recession is Coming! (Eventually)
OK, we’re a little late for April Fools, so we’ll debunk the title of this article immediately. But we saw a tweet last week that pretty much summed up our take on the world. It comes from Morgan Housel, who is the author of an interesting book called “The Psychology of Money.”
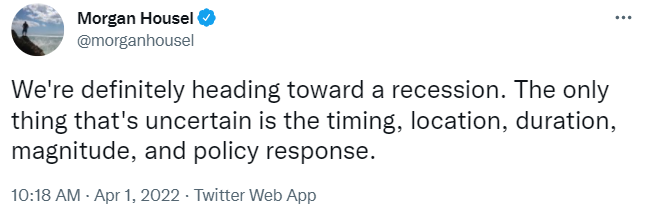
We’ve complained a lot over the last decade about the point Mr. Housel is making quite well here: there is an industry of “financial gurus” who make a lot of money making the “the world is collapsing!” argument. The best part? One day they’ll be right, and we’ll have to hear for years about the time they predicted the great financial crash of 20XX. But no one will talk about how they were wrong for 20 years first.
It’s been a busy year for the gurus. Remember us writing about Jeremy Grantham predicting a 50% correction in the stock market? That was back on January 24th. The market dropped – undoubtedly – but it’s up 2.51% from the day we sent that memo. Not exactly end times.
The latest revelation (yes – we used that word on purpose!)? The (dum, dum, dum…) INVERTED YIELD CURVE!! That must mean a recession is coming, right?
Well, first let’s say this: yes, a recession is coming. A recession is always coming. If you were born 70 years ago, you’ve lived through eleven recessions. That is one, on average, every 6.4 years.
But the yield curve story sure sounds scary. And it’s something we’ve discussed a lot with our clients in the past. Let’s take some time this week to separate fact from fiction.
Did the Yield Curve Invert? And Why Does It Matter?
Before we dive into this, there needs to be a discussion about what the yield curve is, and why it matters if it inverts. The yield curve is the spread between two different issuances of treasury securities. For example, today the 30-year T-Bond is trading at yield of 2.44%. The 1-year T-Bill is trading at 1.63%. The spread is 0.81%. If that spread number is positive, the curve is not inverted. If it’s negative, the curve is inverted.
So why would a yield curve invert? The curve inverts if investors are skittish about the longer-term prospects for the economy. They are making the bet that equities are not the place to be and are moving to the safety of longer-term Treasuries (driving down yields). At the same time, this also often happens when shorter-term rates are driven higher (see: Fed tightening cycle), thus causing the rates to cross.
Then we get to the fun part. The gurus would tell you, historically, an inversion of the yield curve is an indication of an upcoming recession. OK. We’ll grant them that. But which yield curve? There are eleven key treasury issuances ranging from 1-month T-Bills to 30-year T-Bonds. As such, there are fifty-five different combinations of yield curves! Which one to choose?
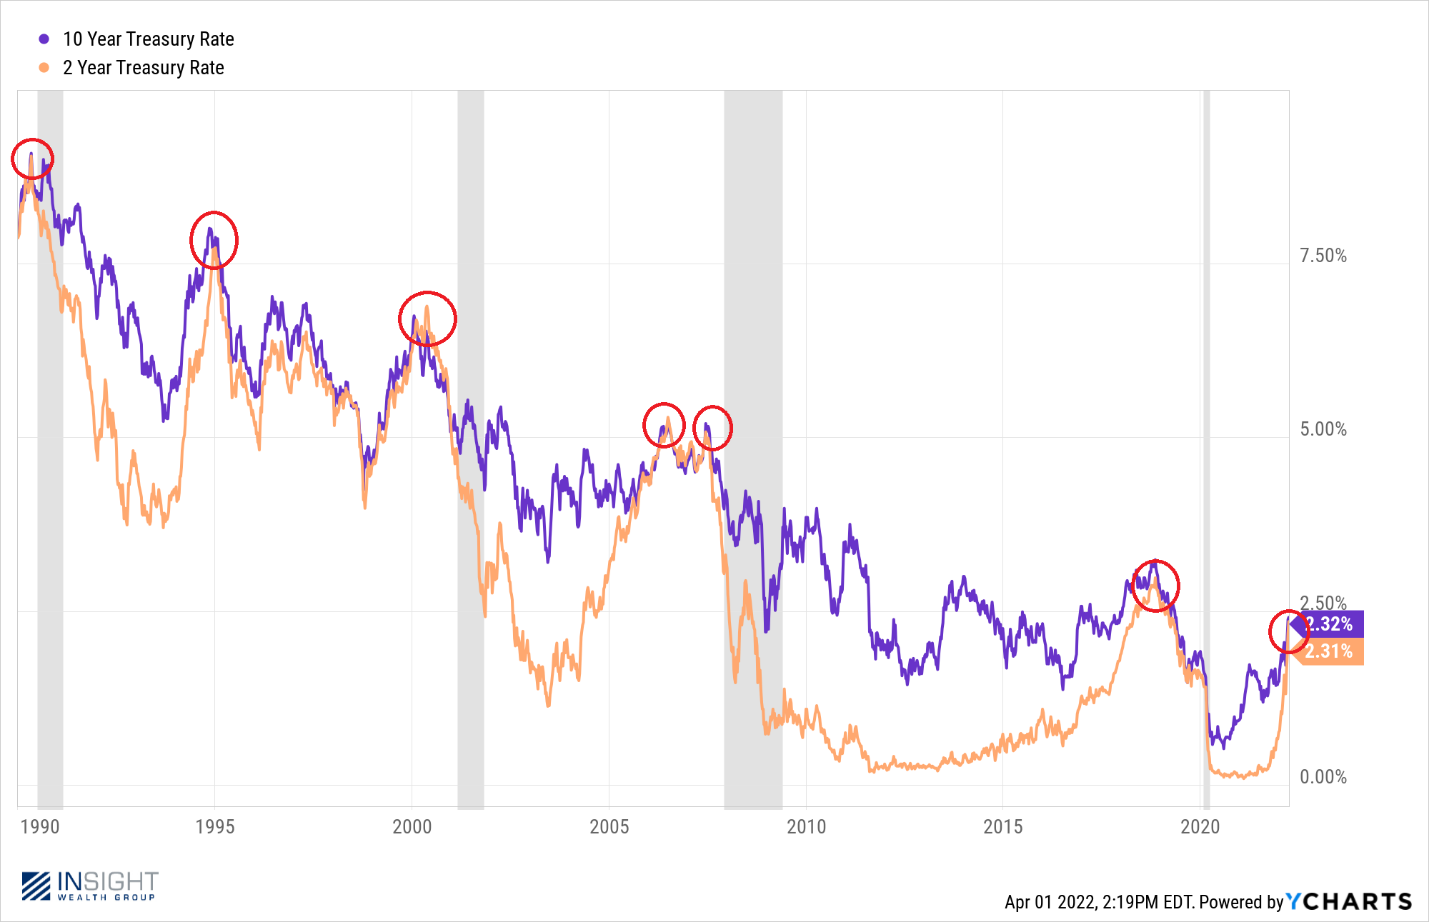
The one that got a lot of talk this week was the 10-year minus the 2-year. It inverted for a brief period. But how predictive is it, really, in telling us there is a recession coming? Let’s look at the chart going back to 1990.
Past performance is not indicative of future results
As you can see, the curve has inverted seven times in the last 32 years. We’ve had four recessions – but we would argue the inversion in 2018 was not in any way predictive of what happened with COVID. So, the 10-year minus the 2-year has been right 3 out of 7 times.
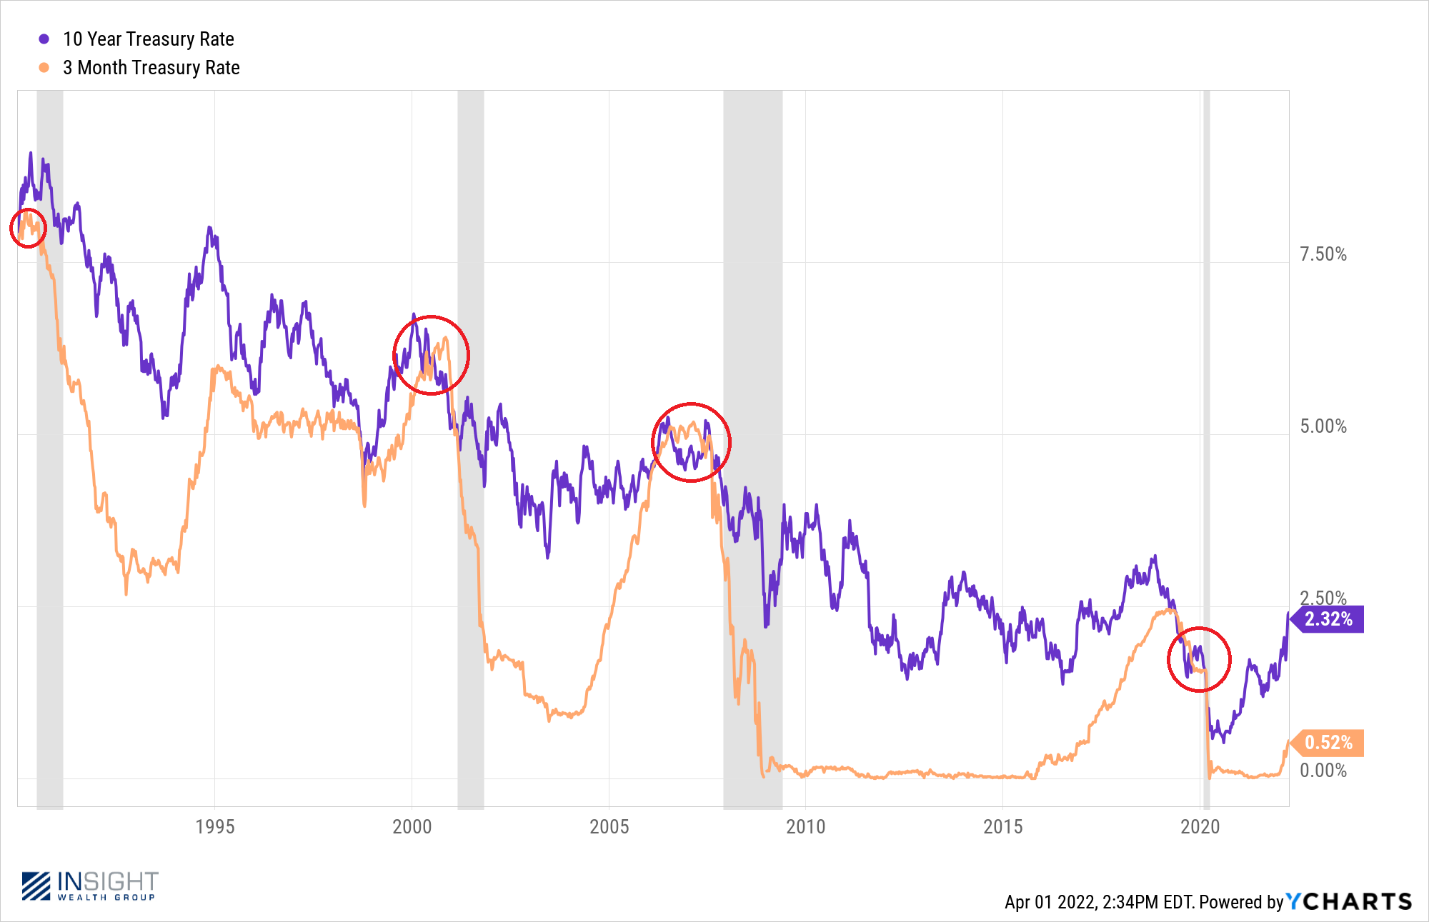
In our opinion – and that of most serious analysts – the much more predictive yield curve is the 10-year minus the 3-month. Here’s its chart going back to 1990.
Past performance is not indicative of future results
We’d make the same argument on COVID here – but on the three recessions before it? 3 for 3. And today? The 10-year 3-month curve is a long way from inverting. The yield curve is great fodder for the gurus. But we’re not at a panic point…yet.
Economic Data Update
We promised an update last week on what we saw on the economic reporting front this week. Overall, we got some solid data.
The unemployment and payroll data on Friday was the headline report. Was it stunning? No. But the economy added 431,000 jobs last month. That’s healthy by any standard. And the unemployment rate fell from 3.8% to 3.6%. Americans that want to work are working.
We spent a good bit of time talking last week about Manufacturing PMI. As a refresher, we want a number that is above 50 – indicating growth in the sector. The February number was huge – 58.6 – and we discussed how falling from that number would be okay, if it wasn’t a big drop. It wasn’t. PMI came in at 57.1 which is a very solid number.

Inflation Update
The inflation story is going to be with us for a while – and it is the story as far as we’re concerned. What happens with inflation will have a significant impact on what happens with interest rates and interest rates will have a significant impact on the market.
You’ve heard our take on this in the past: yes, the Fed has a role to play, but the natural drivers of inflation (or deflation) will also have their say. And we also think they may play a bigger role than the Fed… eventually.
So, when we see an interesting data point on this topic, we’re going to share it. And we won’t just share the ones that back up our point (even though the one we’re about to show you certainly does).
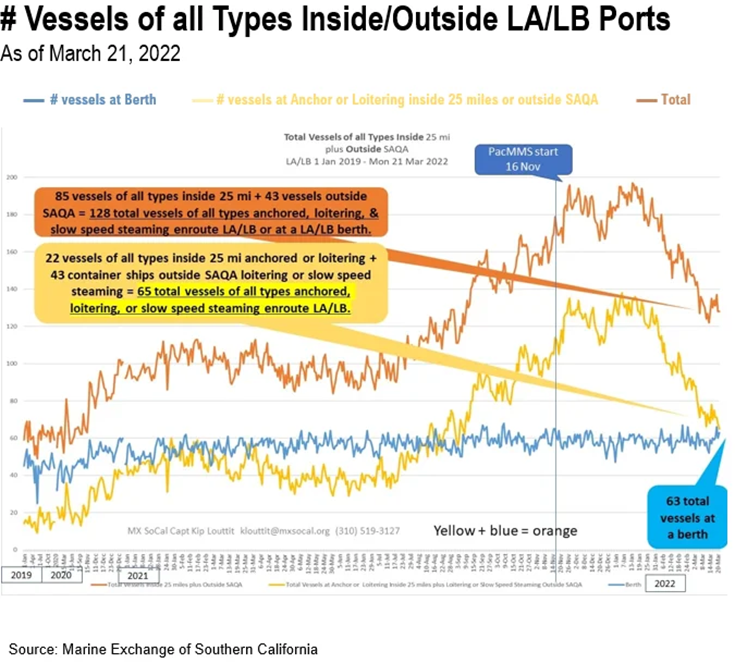
We’ve mentioned shipping data in the past and what we’re seeing today continues to tell the same story: wait times at ports are still not where they need to be, but things are improving drastically. Just look at this data from the ports of Los Angeles.
Past performance is not indicative of future results
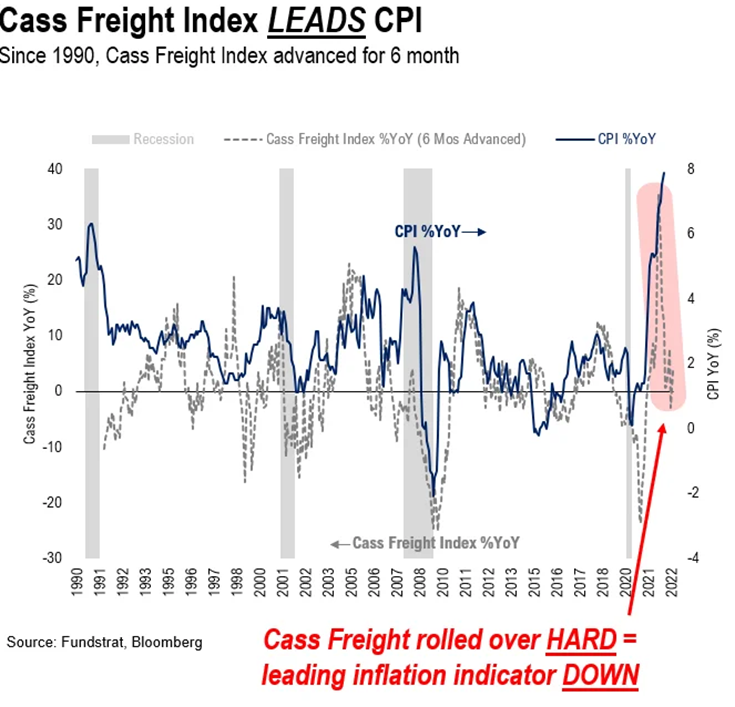
That helps us understand what’s happening now, but what about looking out into the future? Our friends at Taiber Kosmala shared a chart with us last week which we found fascinating. It looks at the change in the cost of freight. Even considering the spiking price of oil, the Cass Freight Index (CFI) has collapsed. What’s particularly interesting about this is the CFI has consistently been a leading indicator of inflation. That’s good news.
Past performance is not indicative of future results
We’ll leave it there for this week. As always, if you have any questions about this information – or would like to better understand how it relates to your personal portfolio – please don’t hesitate to give us a call. We hope you have a wonderful week!
Sincerely,