

The Weekly Insight Podcast – Time to Pick a Side?
Before we dive in this week, we wanted to take just a moment to say thank you to the more than 600 people (!) who joined us at the Iowa State Fair this weekend. What started out – 13 years ago – as a small “family picnic” for clients has turned into a tremendous opportunity to say thank you to the people that make the Insight Companies possible. It’s such a joy to see each of you. And the effort so many made to come from places like California, Florida, Kansas, Maryland, Minnesota, and other far flung places makes it even more special. If you haven’t had a chance to come yet – we’ll be there next year! Mark your calendar for Saturday, August 14th, 2027!
Now on to business. You’ve heard us talk a lot about “investor psychology” over the years. The “be greedy when others are fearful…and fearful when others are greedy” mantra that is enormously important for serious investors to understand.
But what if we told you we were in a moment of both fear and greed? What do you do then? How do you solve for that in your portfolio strategy?
The Greed: Wall Street
Things are going remarkably well on Wall Street right now. War in the Middle East? Meh. Inflation rising (and then falling)? Meh. Is the Fed going to raise (or hold, or lower) interest rates? Meh. Instead, the market just keeps breaking records.
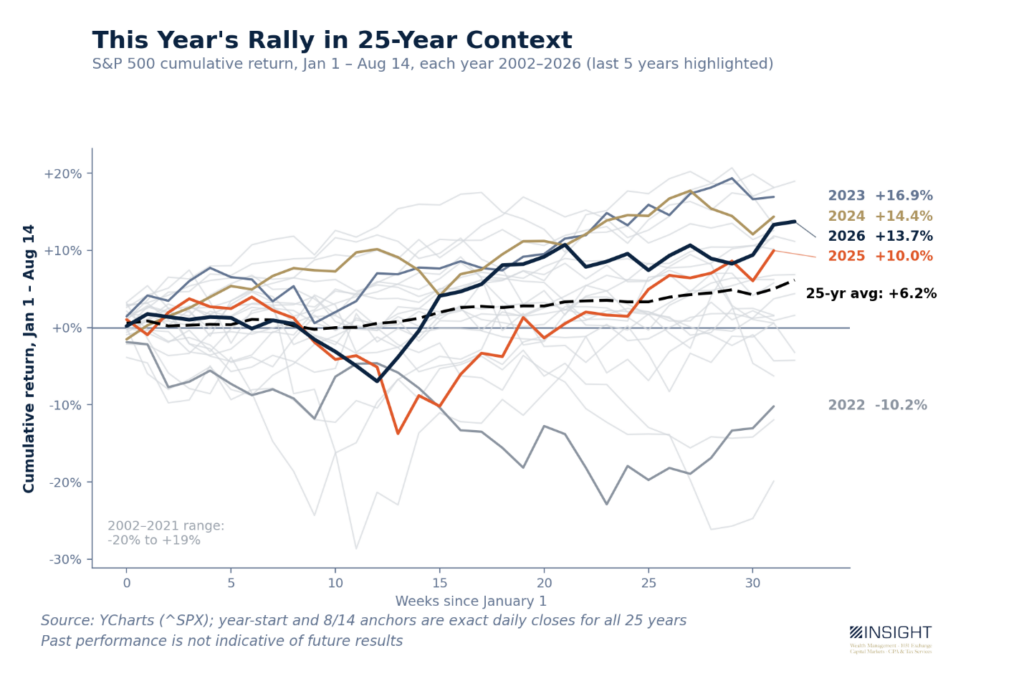
Year-to-date the S&P 500 is up 13.74% through Friday. That’s a remarkably good return. In fact, it’s better than double the average return in the market through mid-August for the last twenty-five years.
Past performance is not indicative of future results.
But, as the chart above shows, it’s just the third best return through August 15th of the last five years. We have truly only known feast or famine since COVID. Three of the last five years have been world beating. One was one of the worst since the turn of the century. Only 2025 (last year) was “average”.
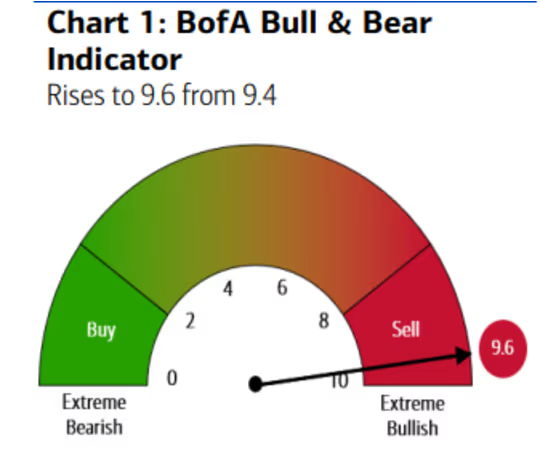
That eventually has a cumulative effect. And Bank of America has been pointing it out over the last few weeks. They run a weekly “Bull/Bear” indicator, and it is flashing one of the most dramatic periods of market greed we’ve ever seen.
Before we get to the results, let’s look at what BofA studies. Their Bull/Bear Index measures six variables:
- Fund Manager Cash Levels: This is looking at “dry powder” managers have available. Any level below 4% is considered extreme. Today it sits at 3.6%. Extreme Bullish
- Equity Fund Flows: Global data shows $16.1 billion flowed into equity markets just last week. That pace – annualized at $837 billion – shows aggressive rotation to equities. Extreme Bullish
- High-Yield Bond Flows: Like equity flows, but instead an indicator the market is willing to drive up risk to add yield. This was a big driver in the Bull/Bear indicator earlier this summer but has eased back a bit. Neutral to Bullish
- Market Breadth: This is looking at where equity indices are trading relative to their 200-day moving average. Roughly 98% of indices around the world are trading above that level. Extreme Bullish
- Credit Market Technicals: This looks at the spread between high-yield bonds and “Tier 1” (high quality) debt. They have compressed to near-historic lows. Extreme Bullish
- Hedge Fund Positioning: Long/short hedge funds have aggressively expanded their net equity positions in recent months (ironically after sitting on the sidelines for tremendous rallies since 2022). Extreme Bullish
Put together, this is one of the “greediest” moments on Wall Street. Institutional portfolio managers and retail investors have collectively positioned for a flawless macro environment. And we all know that’s not true (ever). Bank of America deems it a time to “sell.”
Source: Bank of America
Not a recommendation. Past performance has not been predictive of future results.
A graphic like that one is enough to make most investors run to their computers and slam the “sell” button. Especially if you’ve been listening to us about “fear and greed” for the last several years.
But before we do, let’s do a bit more digging. How frequent is it that this indicator (started nearly a quarter century ago) has hit this level? And what have the future results been?
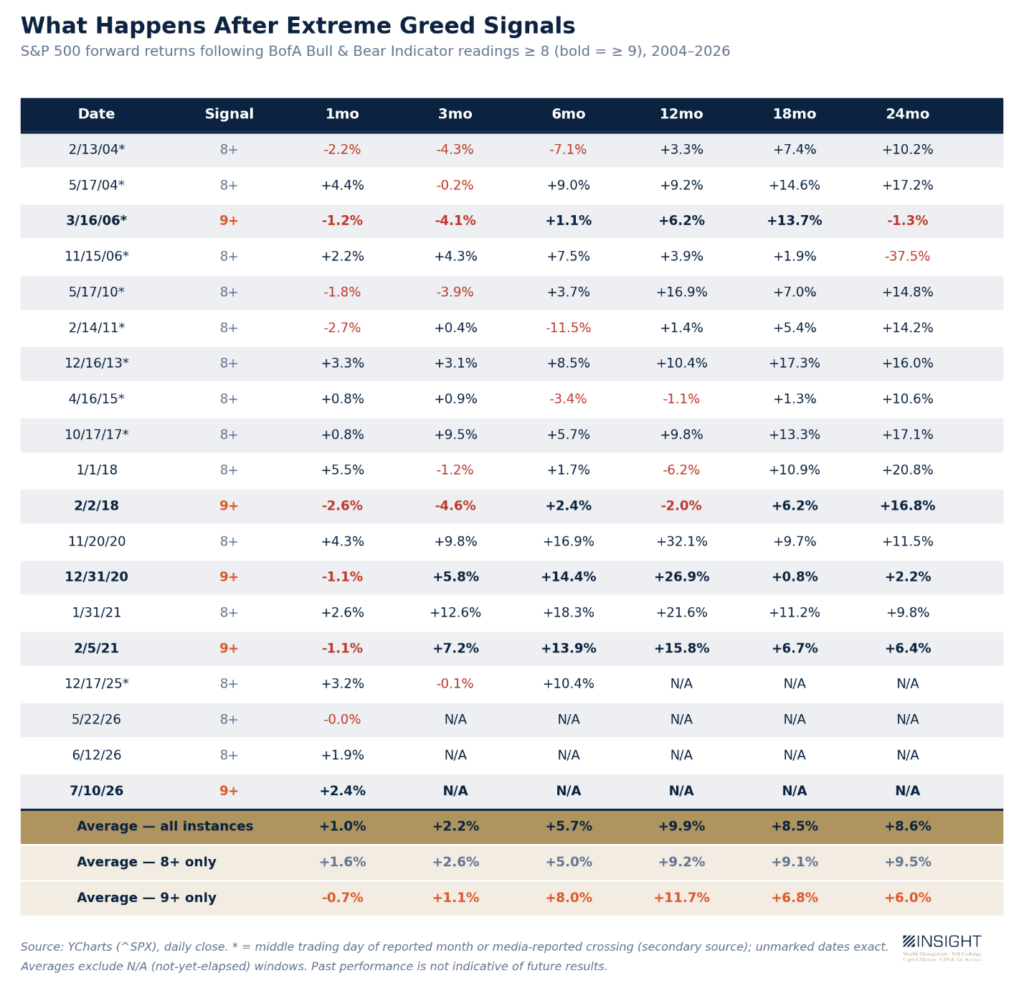
We found 14 instances of the indicator clearing the “Sell” level (8+) and five instances of it clearing 9+. The average 12-month return in the S&P 500 from that point forward? 9.9%
Past performance is not indicative of future results.
Only three times was the market negative 12 months later, never worse than 6.2%. Only twice was it negative 24 months later. That -37.5% number from November 2006 – November 2008 was a nasty one. But it was by far the anomaly.
The Fear: Main Street
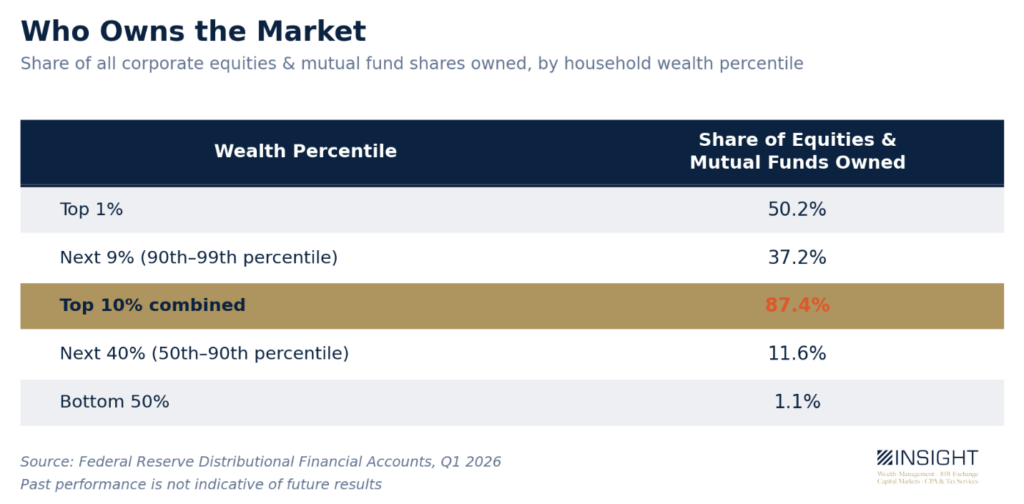
Far too often “the market” gets confused for “the economy.” It’s simply not true. In fact, nearly 90% of the market is owned by the top 10% of households by net worth. The bottom 50% own less than 1% of “the market”.
Past performance is not indicative of future results.
So, when we say the market is “greedy” or “fearful,” it’s really just how investors feel.
That’s not always a bad thing. People with money are the ones who create jobs. So, when they’re optimistic about things, they’re investing in growing businesses, hiring people, etc. That can – and does – trickle down.
But we also must remember that the behavior of consumers is a HUGE driver in the economy and, eventually, the market. Yes, the top 10 percent of income earners make up a disproportionate amount of consumer spending. Yet the bottom 90% still make up the majority of spending. While some estimates place their consumption at ~51%, more recent academic work places it at 60 – 80% of spending.
So, when we look to the market to gauge economic sentiment, we’re missing the sentiment of 9 in 10 Americans and up to 8 in 10 dollars spent each day. When those Americans speak with their dollars, the market better pay attention. And they’re telling a much different story today than the very bullish market.
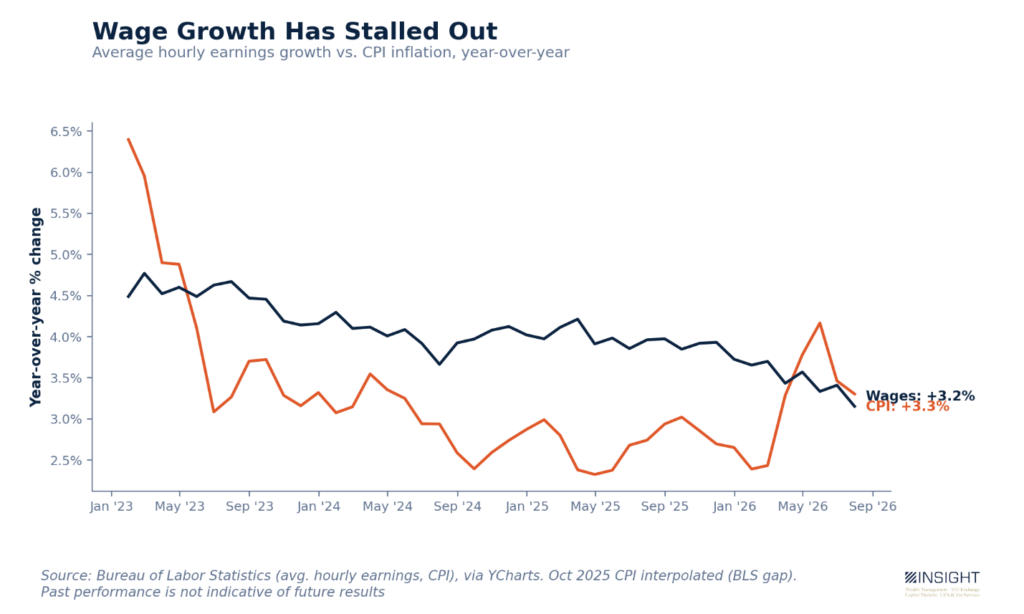
The headlines about inflation since the start of the conflict in Iran have been persistent. But oil prices – while higher – haven’t exploded and inflation has had a similar reaction. But the real headline shouldn’t be about inflation. It should be about how much a wage buys in today’s economy. In recent years, real wage growth in this country (wage growth minus inflation) has been strongly positive. Not anymore.
Past performance is not indicative of future results.
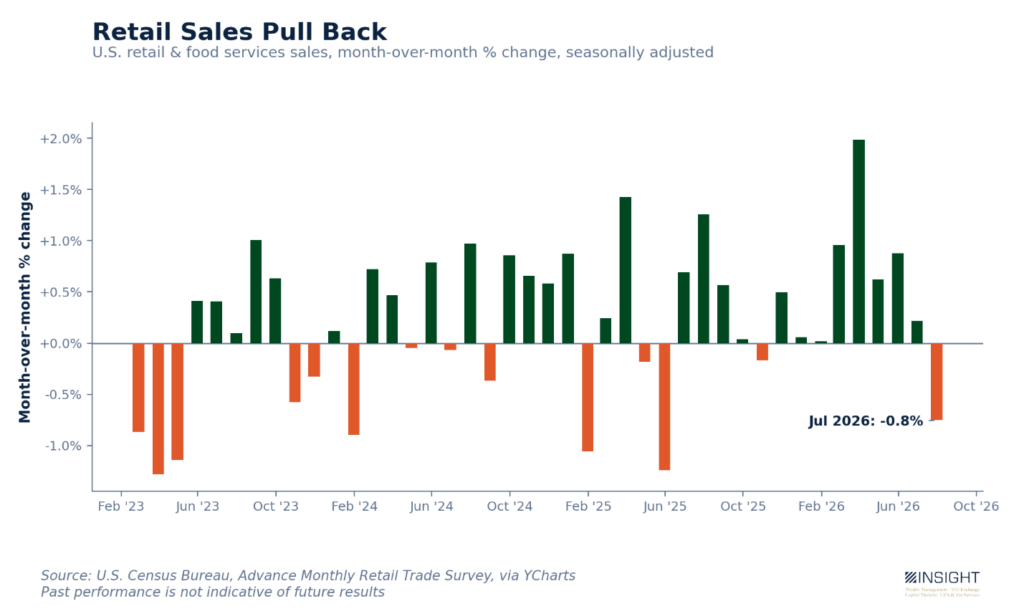
With falling real wages, it shouldn’t be surprising that retail sales are tightening up as well. After a blistering start to the year – strongly supported by massive tax refunds – July posted the worst pull back in retail sales in 13 months.
Past performance is not indicative of future results.
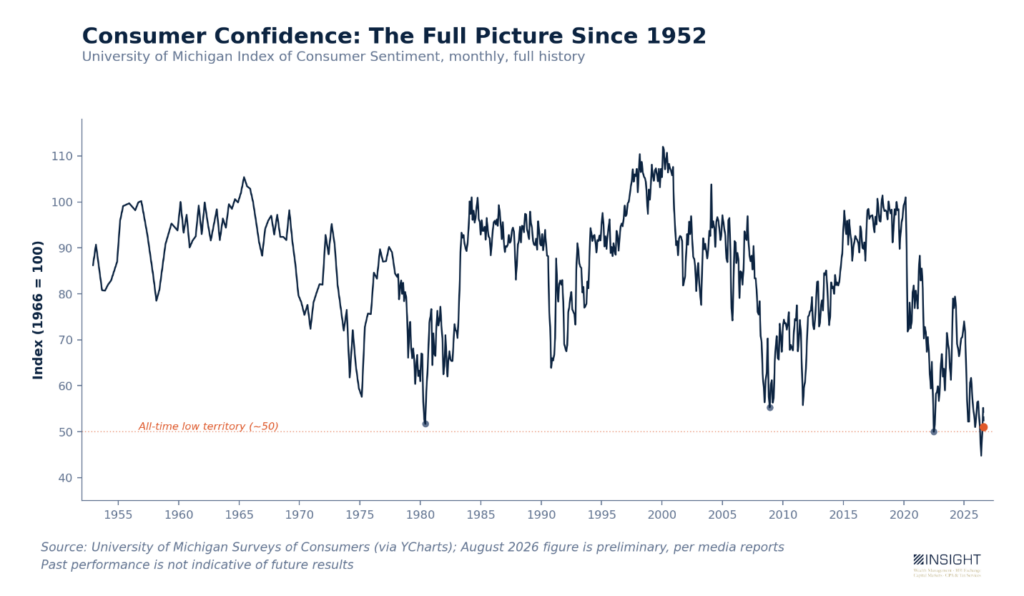
And then there is consumer confidence. A short-term scale of the data doesn’t do it justice. When you run the data all the way back to the start (1952) you can begin to understand the scale of just how bad the consumer feels about the situation today.
Past performance is not indicative of future results.
Pick a Side? No Thanks.
On one side the market is as optimistic as it could be. By Bank of America’s measurement, as optimistic as it has been since 2002.
On the other hand, you have a consumer as pessimistic as we’ve ever measured.
Both are extremes. Neither is a forecast.
What we do know: extremes like this don’t resolve gently. They correct. Someone is proven right. The only question is which side corrects toward the other. No one – including us – gets to know who wins in advance.
The discipline isn’t picking a side. It’s making sure you haven’t already done so without realizing it.
Has your portfolio quietly become concentrated in the handful of names and sectors that have carried this rally over the last three years? If you own a big position in an S&P 500 index fund in your 401(k), you have the same positioning that’s showing up in Bank of America’s “extreme greed” reading we discussed.
Trimming back your allocation isn’t a call on the market. It’s removing a bet you may not have realized you were already making.
If you’ve been sitting on cash waiting for a “better” entry point, the “worst consumer sentiment data ever” is a pretty good reason to stop waiting for certainty that isn’t coming. A systematic dollar-cost-averaging plan will help you get invested without requiring you to time the market.
Neither of those changes requires you to pick a side. That’s the point. When sentiment swings this hard in opposite directions, the correct response isn’t a prediction. It’s a portfolio built to survive being wrong about which one breaks first.
Sincerely,