
The Weekly Insight Podcast – What’s Going On?
We were sitting at our desk on Friday when a link was forwarded over to us. It sent us to the homepage of news aggregator Drudge Report and featured this headline:
Oof. Worst November since 2008 in the markets? Any time someone compares the market to 2008 it creates a visceral reaction in our office. 2008 was a brutal, brutal time to be an investor. Can this possibly be as bad?
So, we had to go back and look. How bad were the first seven days of November 2008? And how bad are things right now?
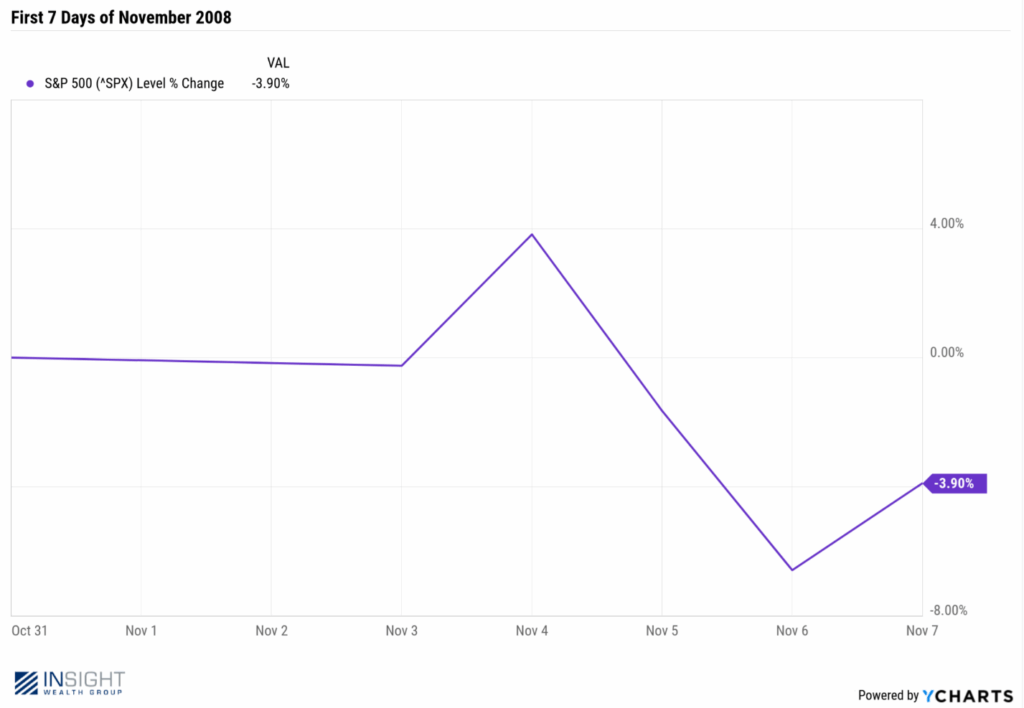
Here is the chart for November 1 – November 7, 2008:
Past performance is not indicative of future results.
Hmmm. Being down 3.90% isn’t good. We never want to be down at all. But is it really that uncommon? Thankfully, there are tools for that!
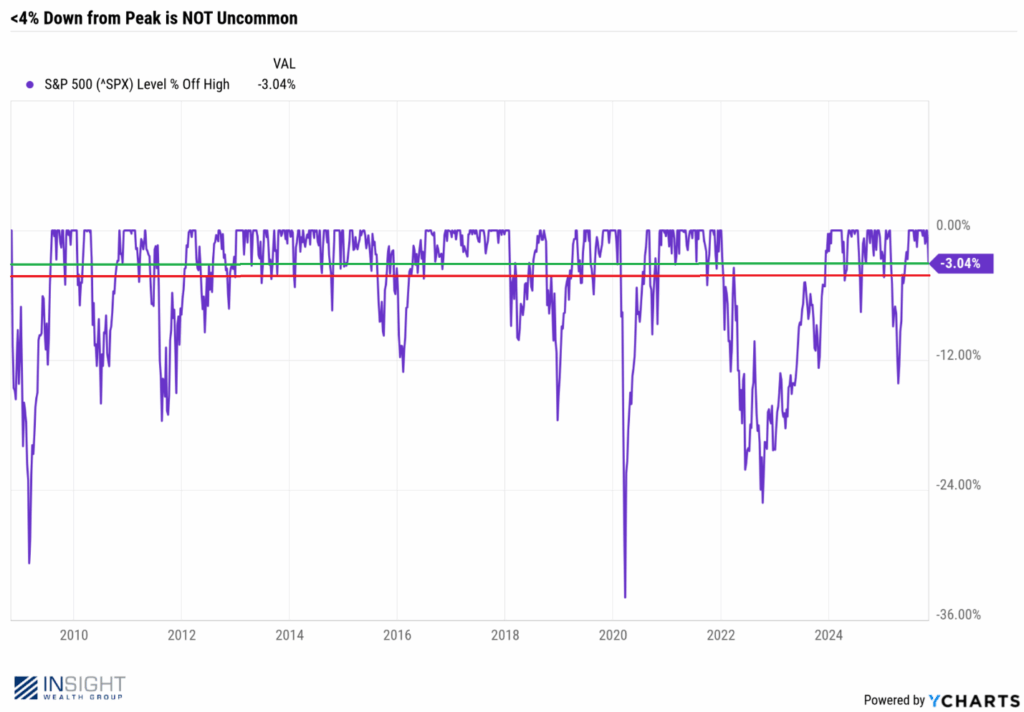
The chart below goes back to November 7, 2008. And it looks at every market movement from a high since then. The red line represents 4% down from peak (slightly more than we saw on November 7, 2008. The green line represents the number of times we’ve been down the same amount from the peak (3.04%) as we found ourselves on Friday.
Past performance is not indicative of future results.
We squinted at this data so you don’t have to. And what does it show? We’ve had a 4% pullback 31 times since 2008. That’s 1.82 times per year. And we’ve had a 3.04% pullback 47 times over the same period. That’s 2.76 times per year.
What in the world are we freaking out about? It just so happens this is the first time it’s happened in the first week of the month of November in 17 years. Whoop-di-doo. As someone once said, we can find a statistical justification for anything if we look hard enough.
Let us be clear: there is no economic data to suggest that we are running headlong into another 2008. In fact – we might point out that by November 2008 – the date the headline uses to cause such angst – the S&P 500 was already down 40.52% from its high – which took place more than a full year earlier in October 2007!
But that’s not to say there isn’t plenty of news and data that is causing fear amongst investors right now. Just in the last week we’ve had to deal with reports of:
- Vehicle sales dropping by more than 1 million units last month
- Another weak month of job growth (42,000 net new jobs via ADP)
- Layoffs rising to 153,000 in October (via Challenger Job Cuts Report)
- Consumer sentiment falling to the lowest level since July of 2022
- The government shutdown becoming the longest in history
- The potential overturn (and repayment) of Trump’s IEEPA tariffs
There is a lot being thrown at investors. So when the headline reads “Worst November Since 2008” you can imagine the reaction that inspires.
But as we’ve said many times in this memo – barring big geopolitical events – things are never nearly as bad (or as good) as they are often made out to be.
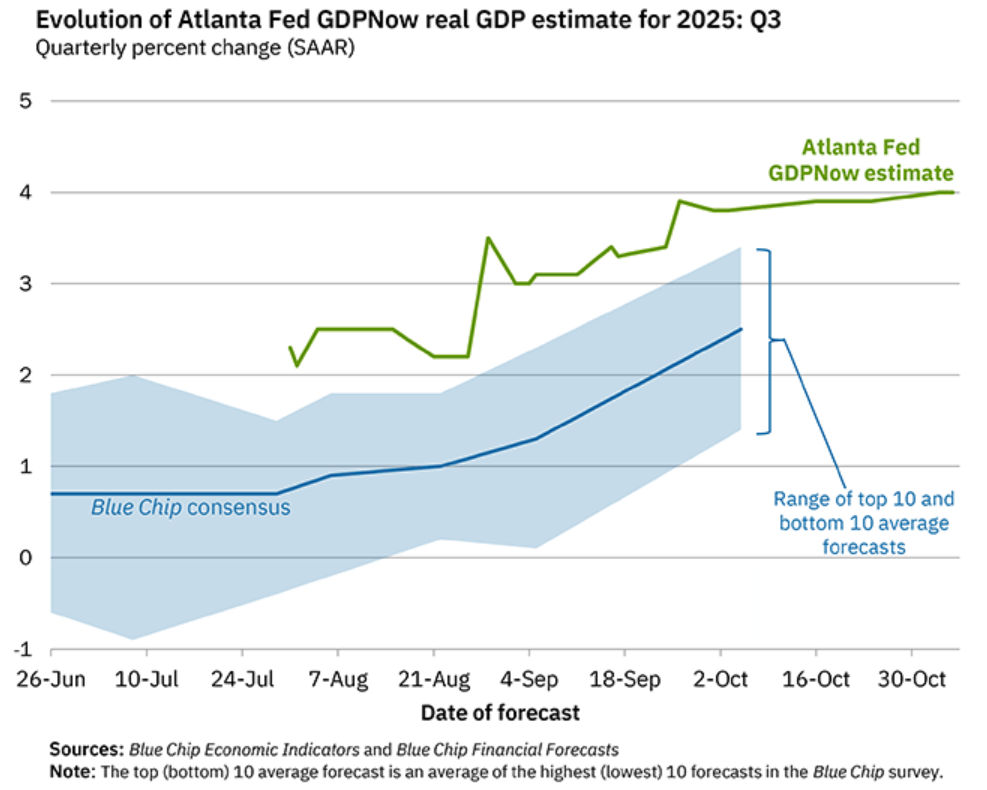
For example, have you heard the news recently that the current Atlanta Fed model for Q3 GDP is showing the number is expected to be 4%? 4%! That’s a tremendously good quarter of growth.
Past performance is not indicative of future results.
Or did you hear that consumer expectations for inflation are falling from their previous highs? Or that both manufacturing and non-manufacturing PMI are both positive and improving?
We’re in limbo-land right now. Everyone feels like a correction is coming. They may be right. But that doesn’t mean catastrophe is around the corner. We’ll say this again for the 1,000th time (because it’s really important!): there is a big difference between corrections that happen with a recession and those that happen without a recession. The magnitude and duration of a correction without a recession is mutiple times less painful.
So where do we sit on the recession curve? There are plenty of pundits screaming about the risk. But what does the actual data say? We’ll bring you back to the formal definition of a recession as defined by the National Bureau of Economic Research: a sustained downward trend over six months of a defined basket of economic measurements.
Here is that dataset as of last Friday. Do you see a sustained downward trend over the last six months?
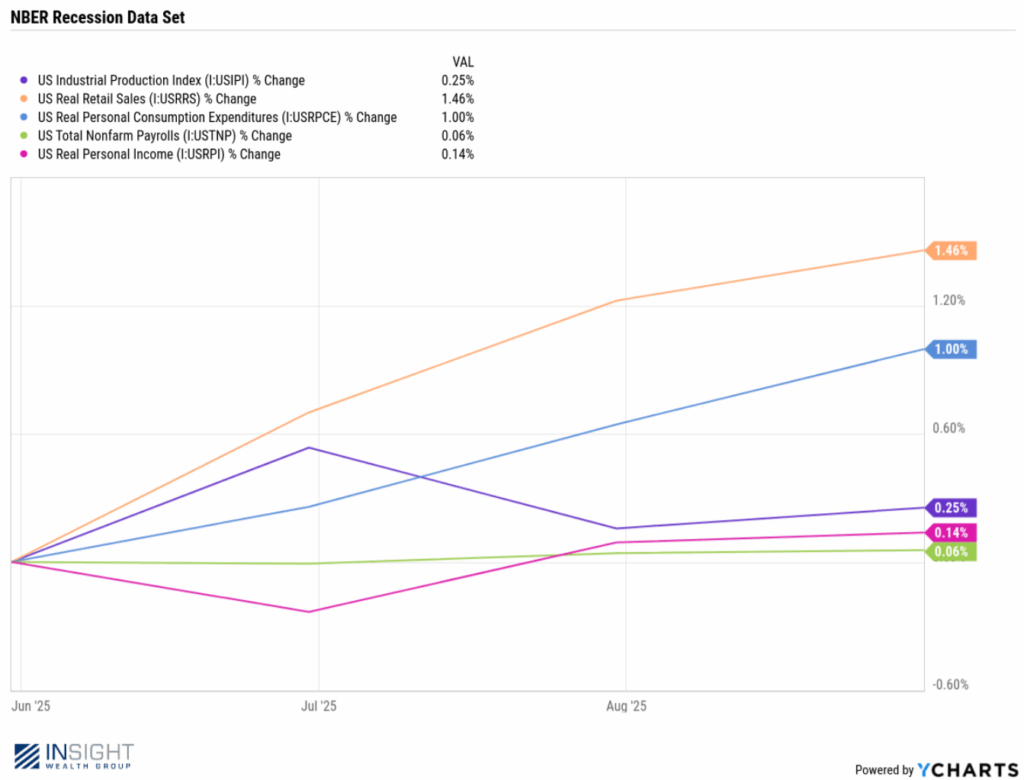
Past performance is not indicative of future results.
But, admittedly, we do have a downward trend in the stock market. And that’s something we should all pay attention to. So where is it coming from?
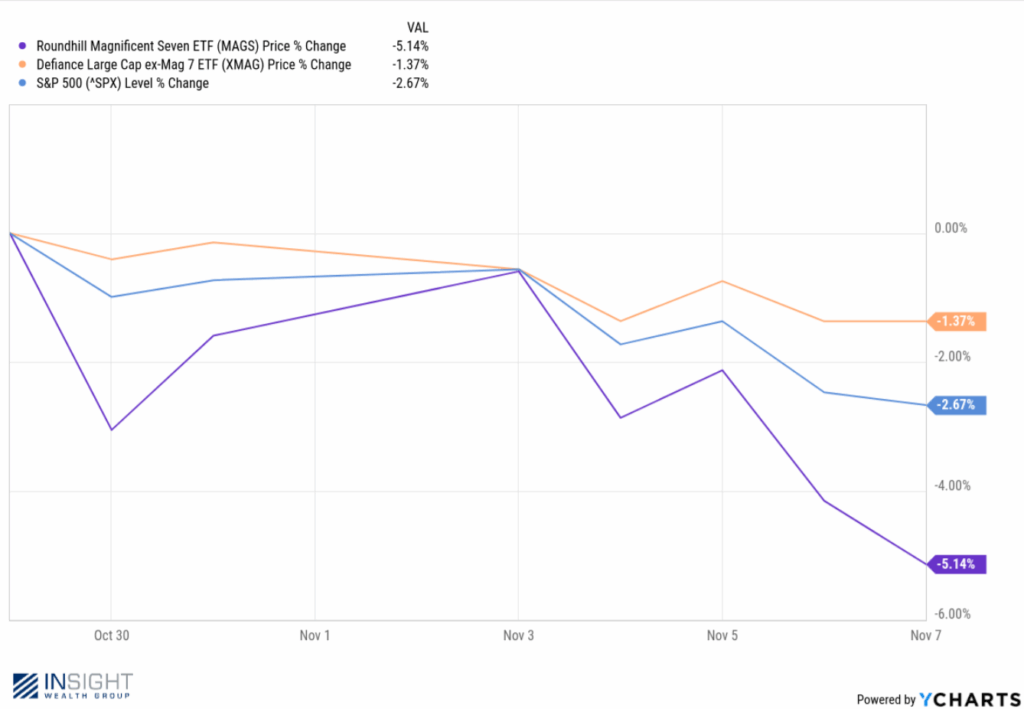
It’s a very simple answer: the recent problems in the market have been driven entirely by the same stocks which lead to the last correction and the growth in-between these two events: the Magnificent 7.
By now you’ve heard us talk a lot about the risk of these seven stocks making up over 35% of the entire S&P 500 Index. It’s a great problem when they’re shooting straight up. It’s not so great when they’re not.
Past performance is not indicative of future results.
The other 493 names in the market are down just 1.37% since the Mag 7 peaked on October 29th. And yet we’re talking about “Worst Novembers”? And recessions? We don’t have a crisis. We have a concentrated stock market. And the concentrated positions are having a bad couple of weeks.
That bad couple of weeks could certainly turn into a bad month, or quarter, or year. We saw a bad quarter for the Mag 7 less than one year ago. And the market is still up over 13% this year. And we saw a bad year throughout all of 2022. And the market is still up over 40% in the last four years.
This isn’t a moment to panic or stress out. Instead it’s a moment to trust the data instead of the headlines. Are we in a time with some uncertainty? Sure. But that’s why we build defense into portfolios. And it is that very uncertainty which provides opportunity in the months to come.
Sincerely,