
The Weekly Insight Podcast – Tug of War
Last week marked the first negative week in the S&P 500 this year, with the market off 0.27%. Not the worst week we have seen in the last few years (anyone remember when we were down 8.5% in one week in February 2020?!?), but an excellent reminder that, while we’re optimistic about 2023, the first half of the year has the potential to be volatile.
We’re not chartists at Insight Wealth Group. There are some in our industry that prescribe significance to “what the chart is telling us”. We’re believers that fundamentals drive charts, not the other way around. But there are a lot of people in the market who do buy into the predictive value of the charts and there is some perspective they can add to what’s going on.
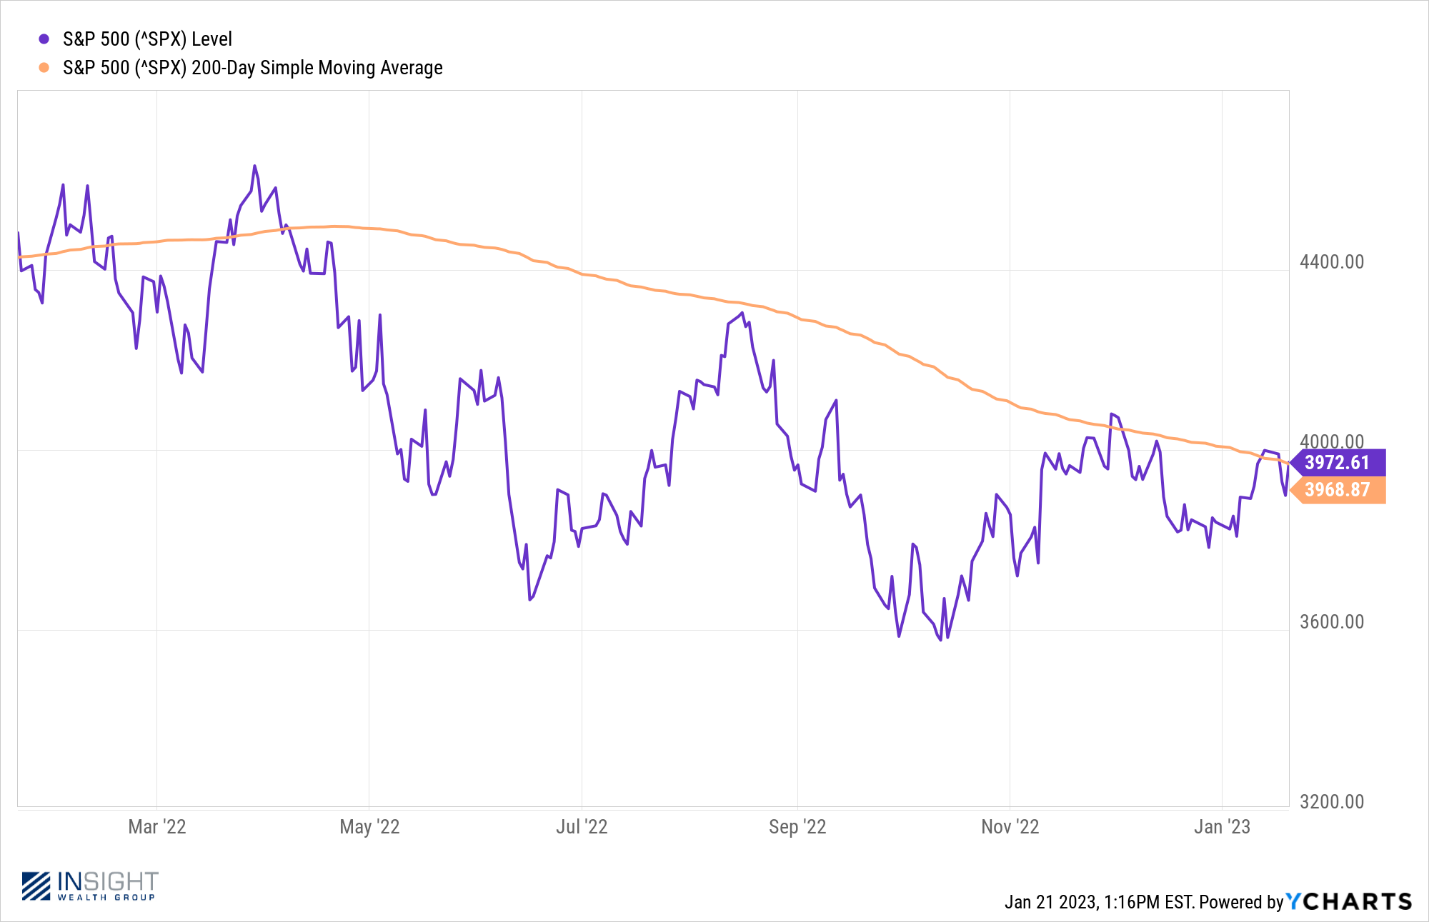
For example, the S&P 500 is bumping up against the 200-day moving average right now. Why is that notable? Because every rally we’ve seen in the market since the beginning of last year has been unable to clear that hurdle.
Past performance is not indicative of future results
After every chart we include in these pages, we are required to include the disclaimer “Past performance is not indicative of future results”. That could not be truer than the chart above. The 200-day moving average is not going to continue to drop until it reaches zero! But the market is going to need something to cause it to break through that trend and drive it the other way.
That means the long-term positive performance of the market this year is about creating “informational momentum”. And the battle for that momentum is a set of intersecting dialogues that were perfectly on display this last week. Let’s take a look at them to better understand what is moving markets now – and what it means for the long-term picture for 2023 and beyond.
The Bad: Earnings
It was a bad week for earnings. Full stop. Fear of an “earnings recession” was brought into full focus as we were able to digest the earnings of some of the largest financial institutions in the world. It was not pretty.
Many of the trends analysts watch in the earnings cycle are struggling this quarter:
- Companies beating their earnings per share estimates are below the 5-year average (67% vs. 77%)
- The size of earnings “surprises” to the up-side are smaller than average (3.3% vs 8.6%)
- The percent of companies beating their revenue estimates is below average (64% vs. 69%)
- The size of revenue “surprises” to the up-side are smaller than average (0.3% vs. 19.9%)
That was all made significantly worse this week due to the earnings from financial giants like Goldman Sachs, All State, etc. Goldman missed their earnings expectations by 59%. All State missed an estimate for $1.90 per share growth in earnings by announcing a $0.65/share loss in earnings. All told, the expectation for Q4 earnings across the entire market dropped last week – from a loss of 4.0% to a loss of 4.6%.
But we also have to remember that only 11% of companies have reported earnings so far. This week alone we’ll see 19% of the market report. Most of the financial names are behind us – and a rising interest rate environment is not good for them when they make money by lending money.

The Good: Economic Data & Fed Comments
The other side of the conversation is what’s going on in the broader economy and how it impacts the inflation/interest rate conversation we’ve been having for nearly a year. Yet again – as we have seen for the last few weeks and months – the data looks pretty good.
New housing starts dropped last month, as did existing home sales. Existing home sales dropped 1.5% after dropping 7.9% in November. They have now dropped every single month since March of last year. The so called “6-to-9 month lag” for Fed policy to hit the economy? There’s some truth to it, but in the housing market, it was nearly immediate. Yet another argument for why CPI completely misses on the “shelter” component.
And speaking of CPI, it’s cousin, the Producers Price Index (PPI) was released on Wednesday. You’ll recall us saying in the past that PPI was the “gold standard” for the Federal Reserve when considering inflation in the past. That seems to have changed for the Powell-led Fed, but PPI still matters. And it did not just slow last month. It dropped. A lot.
Month-over-month (MoM) PPI dropped 0.5% in December, bringing the year-over-year (YoY) number down from 7.3% to 6.2%. Not only were those numbers great – they were much better than the anticipated -0.1% MoM and 6.8% YoY. Core PPI also beat expectations, coming in at 0.1% MoM and 5.5% YoY (vs. 5.7% expected).
All of that is good news as it applies to what the market expects from the Fed on interest rates in the coming weeks and months. Our favorite chart – the FedWatch Tool from CME Group – is now showing a 99.3% chance of a 0.25% rate increase at the next Fed meeting. There is no such thing as certainty (that’s what the other 0.7% is for!), but we’re getting close on the next meeting.
More important, though, is the FedWatch Tool chart for the June Fed meeting. It is this chart which has the highest probability of rates increasing 0.75% or more from where they are today. Total odds of that? 37.5%. We now have a majority opinion (62.5%) that rates will peak out at 4.75% or less, meaning the market assumes only two more 0.25% rate hikes from here.
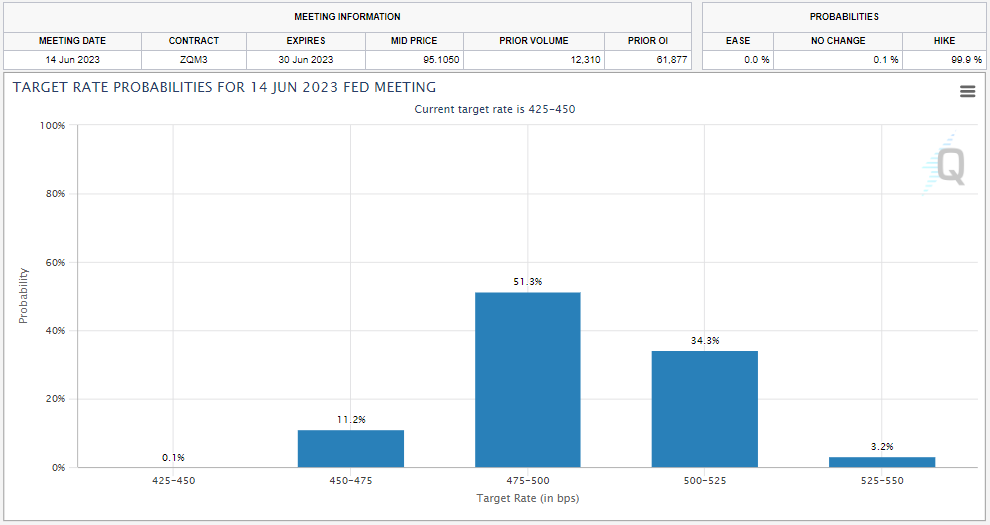
Source: CME Group
Past performance is not indicative of future results
You can see the push and pull that’s happening in the market today. Earnings faltering, economy/inflation improving. This week was a tug-of-war which neither side really won. It is going to take a clear victory for the economy/inflation side for the market to finally break through that 200-day moving average and go for a run.
What will do that? The Fed. While the market is making bold proclamations about what the Fed is going to do, market makers just don’t have a ton of confidence in what path Powell is going to take. Getting a clear signal from the Fed that the path to a peak in interest rates are near is what this market needs to go for a run. But when will we get that sign? The next meeting (February 1st)? March? May? June? No one knows for sure. And until we do, the tug-of-war will continue.
Sincerely,