
The Weekly Insight Podcast – The Next Big Thing(s)
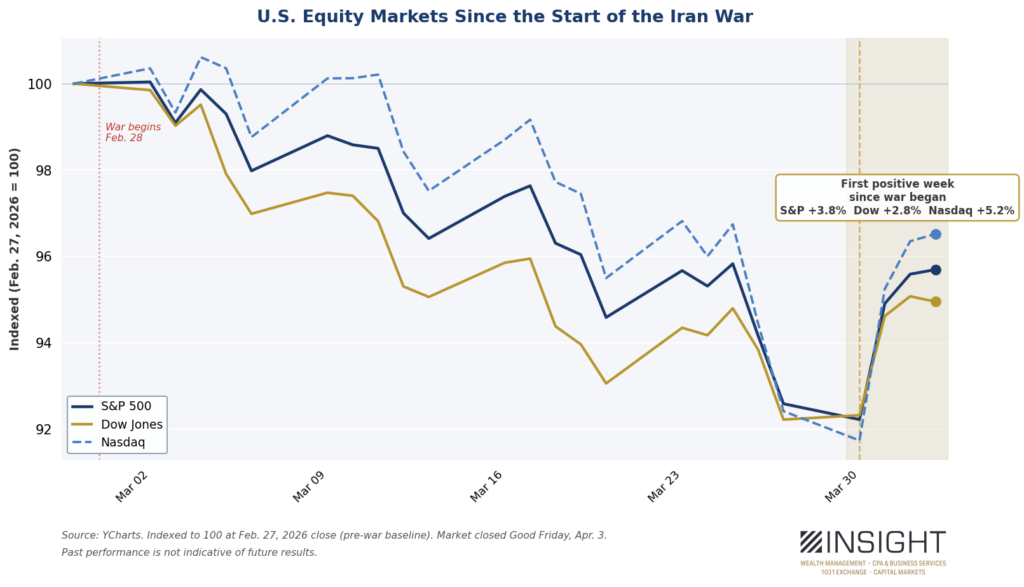
The markets did something last week they haven’t done since the start of the conflict in Iran: they had a positive week! It all started on Tuesday when the President of Iran – Pezeshkian – announced he was open to ending the war “with guarantees.” That led to the best day in the market since last May.
The President added to the momentum as the week went along, announcing that Iran had “just asked the United States of America for a CEASEFIRE!” on Truth Social and mentioned to CNBC that the Strait of Hormuz would “automatically open” if that happened. While markets remain down since the start of the conflict, it was the most noticeable positive movement since the start of the military action.
Past performance is not indicative of future results.
Economic reports throughout the week didn’t hurt either – at least the “headline numbers.” The good news – especially considering the impact of the conflict – was notable:
- Non-farm payrolls: The U.S. added 178,000 jobs in March, a stark reversal from the 133,000 jobs lost in February. This number vastly exceeded the expected result of 59,000 jobs.
- Unemployment: Unemployment ticked down to 4.3% in March. It’s down from a peak of 4.5% in November.
- Consumer Confidence: The Conference Board index edged up to a level of 91.8, well above the consensus forecast of 87.5.
- Retail Sales: Along with confidence, sales rose 0.6% for the month, beating the estimate of 0.5%.
There are two ways to read this: 1) the economy (and consumers) is hanging in there and handling the impact of higher energy prices; 2) or higher energy prices haven’t started to bite yet. Either way – in the short term – this is good news.
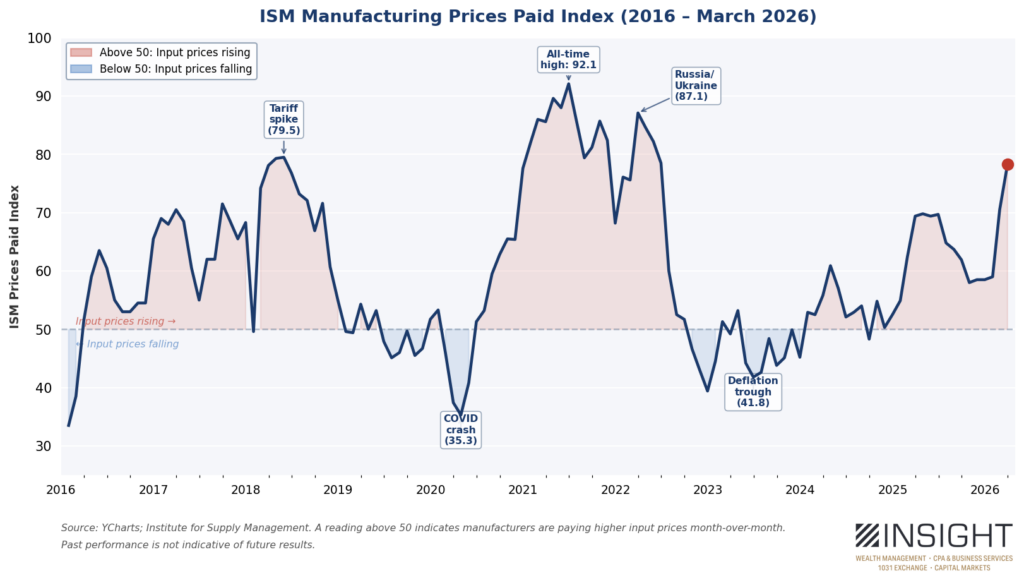
One stat that slipped through without a lot of attention was the ISM Manufacturing Prices Paid Index. It was buried in a largely positive ISM report that saw Manufacturing PMI exceed expectations and show the strongest position since August 2022.
“Prices Paid” is an important metric. It’s measuring the cost of goods before production. It’s measuring what it costs to make a product compared to what it cost the month before. And in March it took a big leap. The biggest? No. But it was notable. The index has climbed from 59 to 78.3 over the last three months. That’s a 33.3% jump in 90 days.
Past performance is not indicative of future results.
TD Bank Economics called it the “dominant warning signal” from the ISM report. We’d argue it’s a signal of the impact of this conflict, but it is also a very flexible statistic as shown by the previous peaks and valleys. If the war ends quickly, we expect it to fall quickly. If not, it is certainly a sign of impending inflation.
The most important story for Monday, April 6th will continue to be the war – most specifically the deadline imposed by President Trump to reach a ceasefire which ends Tuesday at 8:00PM EST. Will a ceasefire be reached in time? Will the deadline be extended? Will the war expand to a more volatile situation?
None of us know. Unless you have a friend who is participating in the negotiations (if so, please call us!), there is no way to predict these moments.
But given the relative strength of the market and the economy right now, we have some flexibility to think about the future beyond this conflict. What do markets look like? And where should we be focusing our dollars? There will be many opportunities, but this week, we want to call out three that are worth our consideration.
North American Natural Gas
We’ve been talking for weeks about our healthy exposure to energy in portfolios. It’s one of the reasons clients have handled this moment so well. But the energy opportunity doesn’t end the day the war ends. Too much damage has been done.
As you will recall, Qatar is a massive producer and exporter of Liquified Natural Gas (LNG). This market has exploded in recent years as Asia’s energy demands expand and Europe looks for new sources of gas after the issues surrounding the Russian/Ukraine war.
The market has been dominated by three countries: The United States, Qatar, and Australia. In 2025, they made up nearly two-thirds of all LNG exports. Qatar alone provides 20% of the world’s LNG supply, 83% of which goes to Asia. That is ALL offline right now. And it’s not coming online again immediately following the end of the war. The damage to the Ras Laffan facility has – in Qatar’s words – taken 13 million metric tons annually offline for at least 3 – 5 years.
North American gas investors have probably been disappointed by this moment. Gas prices haven’t gone up. Gas producer stocks haven’t participated in the big energy gains of this moment. For example, Birchcliff Energy – a significant holding in client accounts – is down (slightly) since the start of the conflict.
But that is a short-sighted approach. Why? The moment that Qatar LNG production is suffering is exactly the moment Canadian gas production is coming online.
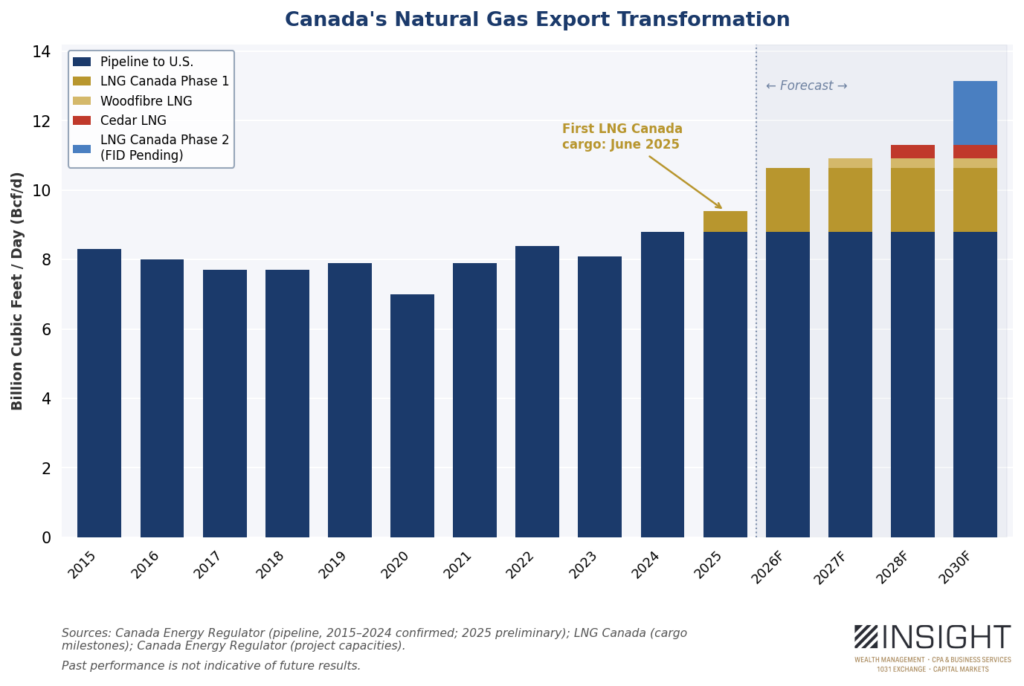
Past performance is not indicative of future results.
The LNG Canada project we’ve been waiting on for years came online last year. It will reach full capacity this year. And more projects are coming. There are at least four in the works at this moment that could substantially increase Canadian LNG exports. More demand is never bad for prices.
And – no matter what – Canada is the easiest shipping point to Asia. A load of LNG gets from British Columbia across the Pacific in 9 days. It’s somewhere from 18 – 22 days from the United States and Qatar. Less time on a boat means cheaper to ship. It’s an attractive moment for their industry to be expanding and an exciting time to be an investor in Canadian natural gas. Sometimes world events work out in our favor.
Emerging Markets
We’ve mentioned this before – but one of the first moves we’ll be looking to take after the war ends is increasing our exposure to emerging markets. This goes back to a pre-war outlook on the world economy and leadership in the U.S.
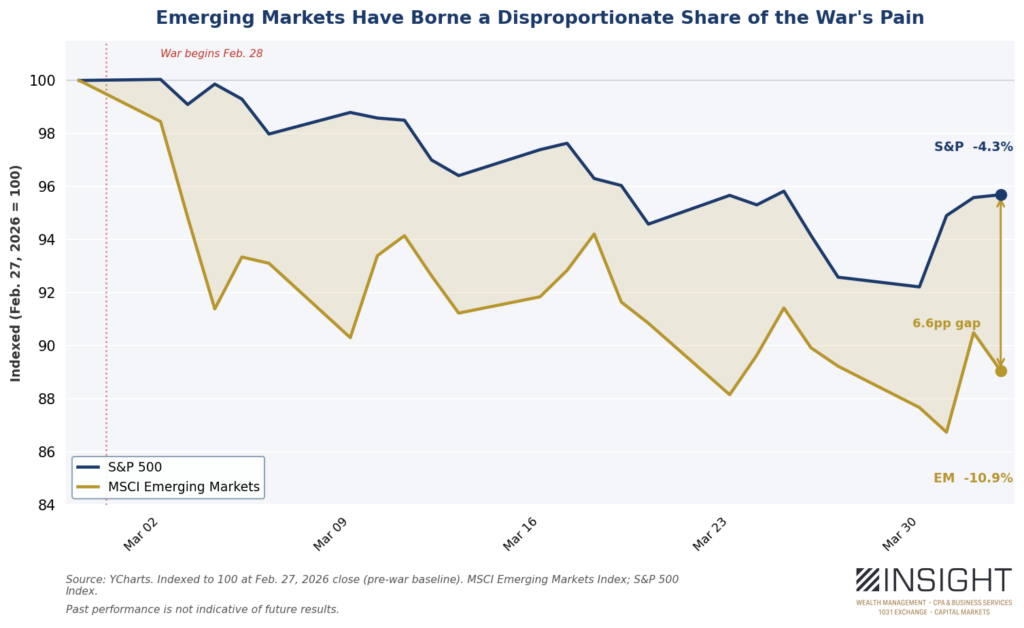
As we noted in our memo The Dollar Trilemma on February 9th, one of the clearest data sets out there is this: a weaker dollar is good for emerging markets (EM). More specifically, peaks in the dollar’s value – and the subsequent fall – have specifically linked to moments of strong performance in EM.
We all know that the Trump Administration has been purposely trying to weaken the dollar. Others can debate that as a strategy. But we also know that this war – and the rising energy prices associated with it – play against that goal.
The dollar devaluation game will continue when the Iran conflict is complete. But what we also know is that falling energy prices benefit this thesis as well. That’s a double opportunity. And it’s particularly notable in the fall EM has taken since the start of the war.
Past performance is not indicative of future results.
Jumping too quickly into this trade could prove painful, especially if the war continues or expands. There’s no reason to rush. The opportunity will still be there.
Small Caps
Small caps is a bit of “same song, second verse”. Much like EM, small caps are traditionally affected more broadly by moments like what we’re seeing in Iran. They are highly exposed to inflation and rising energy prices.
But the story here is a little different. Small caps have performed quite well over the last year – especially since the broadening of the market away from the “Magnificent 7”. And – even since the start of the war – small caps have outperformed the S&P 500.
The opportunity here is more nuanced. Yes, they are historically more impacted by the cost of energy. And inflation. That is largely a debt story.
Approximately 32% of the debt held by companies in the Russell 2000 (the standard small cap index) is floating rate debt. Higher inflation (caused by energy) likely means higher rates. Higher rates – for those 32% of companies – means higher debt service costs. In the S&P 500, only 6% of companies have floating rate debt.
Inflation has a disproportionately larger impact on small cap companies. Even if this moment only causes the Fed to hold rates where they are, larger companies will do better. Hikes and the problem just gets worse.
But the opposite is also true. Rate cuts have a significantly positive impact on small caps. And it’s played out well for portfolios since the start of the latest rate cut cycle which started in September 2024. The Russell 2000 is up nearly 15% over that time.
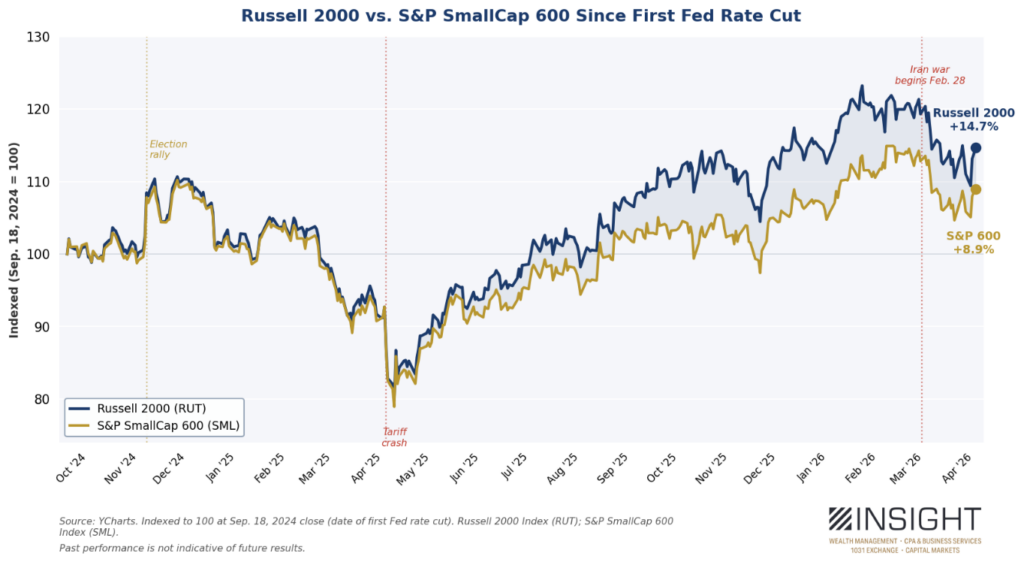
Past performance is not indicative of future results.
Wait a second. What’s that other line on there? The S&P 600? Most investors have never heard of it. It, too, is a small cap index. But its investor exposure is minuscule compared to the Russell 2000. There is no futures market for it. And so, almost all institutions use the Russell 2000 to express their small cap exposure.
What’s the difference? It’s simple. The Russell 2000 is all small cap companies. The S&P 600 is only profitable small cap companies. Not start ups. Companies with real, positive earnings. They just happen to be small.
And, since the bottom of the tariff crash, the market has been betting heavily on the big – often unprofitable – index. The profitable companies have been left behind. Which is wild when you notice just how much the S&P 600 has outperformed the Russell 2000 since the turn of the century.
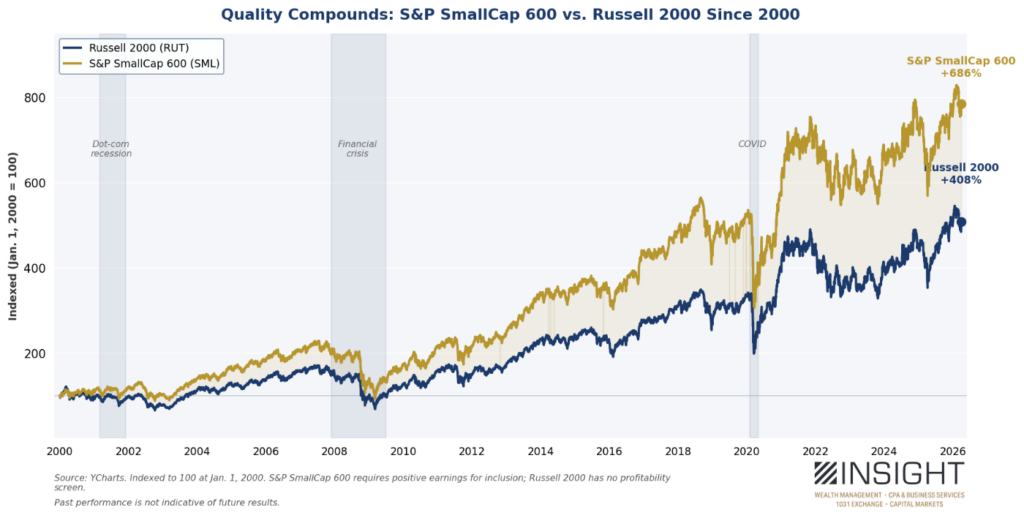
Past performance is not indicative of future results.
The point? Active management – not passive ownership – of quality small cap exposure should be a good place to be when all of this is behind us. The profitability trap will catch up to the Russell 2000’s run over time. Owning well run small caps matters just as much as it does with other stocks.
If you’re an Insight client, some of this is already in your portfolio, ready to go when this war is behind us. Some of it we’re waiting to implement. But the one thing we know is this: even in moments of upheaval, there are opportunities. And we’re always on the hunt for them.
Sincerely,