The Weekly Insight Podcast – The Math Problem: What Do Rising Gas Prices REALLY Mean?
You’re used to this old game by now. Something significant happens in Washington and both sides start spitting out their spin. It’s nothing new. And we all know the spin is ludicrous. But the problem is this: What is the actual truth?
The latest battleground is gas prices as it relates to the current conflict in Iran. We talked last week about it as a duration question when it comes to the stock market. And that’s true. The market continues to shrug it off for the time being.
But if it directly impacts households, it will – eventually – impact the economy. And the spin about that individual level impact is (predictably) wide ranging.
First, there was Rep. Ro Khanna (D-CA) who claimed in a House Armed Services Committee meeting this week that the current conflict was costing each American household $5,000. Maybe – in long term borrowing costs for the Government. But it’s a wild exaggeration of the direct impact on taxpayers.
Then there was Treasury Secretary Scott Bessent. On the exact same day, he said that “All of the cylinders (of the economy) are kicking…. Gas prices continue to come down.”
Yeah, they don’t. In just the last week alone, the average cost of regular unleaded rose nearly $0.35 and it’s up $1.47 (49.33%) since the conflict began.
What Does $1.47 Mean for Real Americans?
That’s the question the spinmeisters aren’t answering right now. How does this impact the consumer? What’s the hit to the pocketbook? Where do they start changing behavior? These are the things we need to understand to plan for the future.
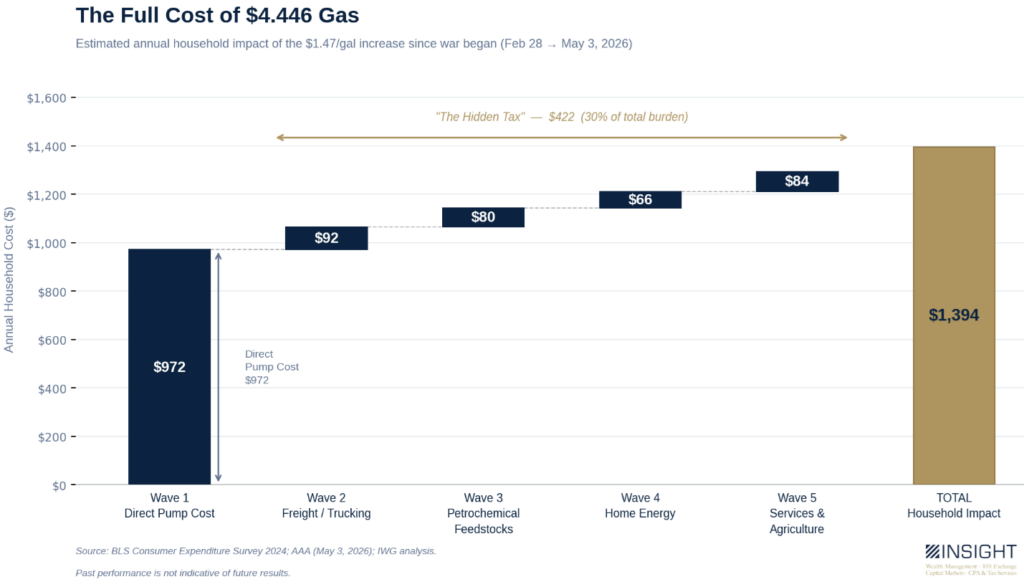
So, let’s look at the easy math first. We know there’s an impact at the pump. That’s obvious. But what about the rest of the impacts? Rising gas prices change freight costs, production costs for food, costs for heating and cooling. All are important to the economy. And that hidden cost – while not showing up at the pump – is a very sticky cost that won’t go away as easily when prices fall.
Past performance is not indicative of future results.
Let’s round that to $1,400 for ease. That’s $117 per month – roughly the cost of an extra cell phone or internet plan. For many households reading this, it’s notable, but not catastrophic. And it’s much smaller than Rep. Khanna’s $5,000.
But when you consider the median household income in the United States is $81,600 (per 2024 Census data), that comes to a 1.7% impact on spending.
Where Could It Go?
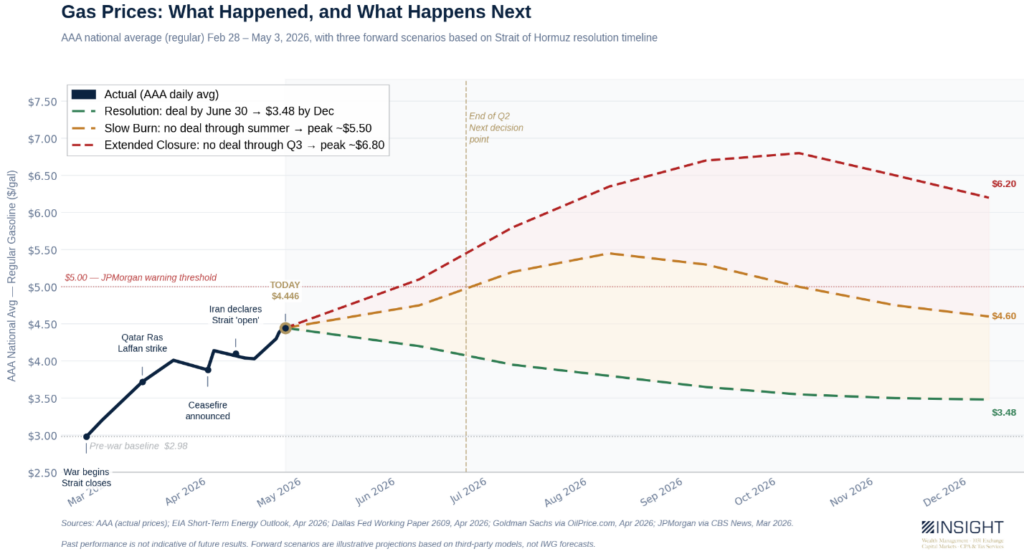
$1,400 is the annual impact as things stand today. But the next step in this math problem must be the variables. And they’re straightforward: we get a significant resolution to this problem, we have a slow burn with partial flows through the Strait (but nothing near full opening), or things continue to get worse from here.
The good news: while gas prices were up significantly this week, things have moderated in the Middle East. The ceasefire is holding and a small amount of oil is flowing through the Strait. Even better? Pakistan announced last week that they anticipated a new proposal from the Iranians and assured the world that talks were ongoing.
There is a lot of research out there about what happens next. And it’s moved a lot. At the beginning of the conflict, JP Morgan was putting out papers panicking about $5 gas (notably the same firm that, the day before the conflict began stated any impacts of an Iranian conflict would not include “protracted oil supply disruption”!). We now know – two months later – that the $5 level wasn’t breached. But research from the EIA and the Dallas Fed show it’s still quite possible depending on how quickly we get a resolution to this situation.
Past performance is not indicative of future results.
The Math That Matters: Wages vs. Price Increases
Much like the folks in DC, we can show you a lot of worst- and best-case scenarios. But the truth is they are all fiction until they are fact. So, let’s work with the facts as we have them.
First, we know that inflation is rising. But it’s not in a terrible position. Current CPI figures put it at 3.3% year-over-year. That is NOT panic territory. In fact, it is below the long-term average which currently sits at 3.51%. Yes, it’s not the Fed’s “preferred 2%”. But it is workable.
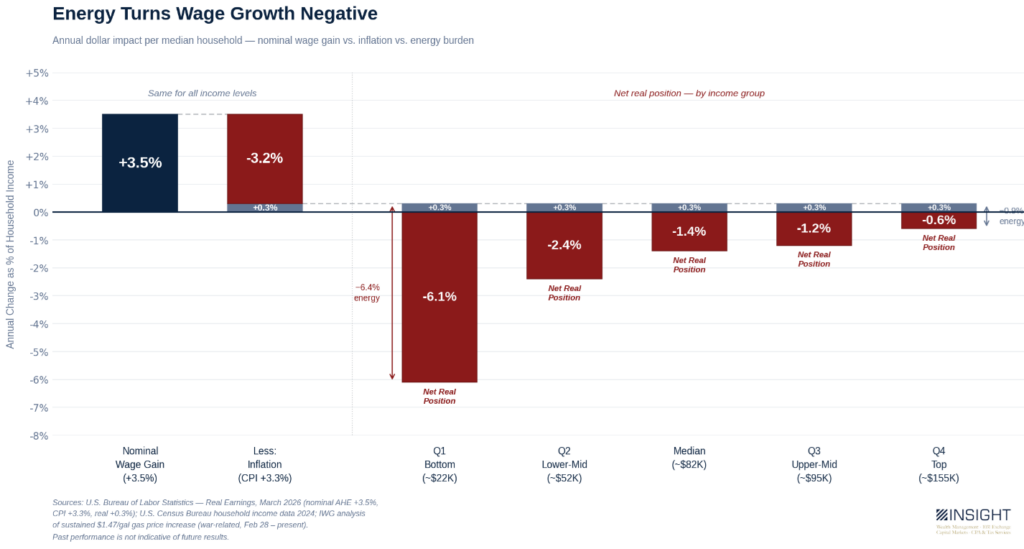
On the surface, wages are keeping up with that inflation…for now. At 3.5% nominal wage growth – minus 3.3% CPI – the median household is getting a $245 raise right now (roughly 0.3%). But then the energy bill shows up.
When you take away another $1,400 from that mix, we now see real purchasing power negative for the first time since 2022. But it’s not just the median earner. The impact is disproportionately felt for lower wage earners, but it would negatively impact all four quartiles of earners.
Past performance is not indicative of future results.
When Does the Market Move?
This is the question we’ve been asking for a long time now – and specifically discussed in last week’s memo. Simply put we don’t know. And anyone who tries to predict it will undoubtedly be wrong (or extremely lucky).
But we do know this: falling real wages have a real impact on the economy.
And coming at a time when consumer sentiment is at all time lows is just another log on the fire.
Does this mean a recession is imminent? No. There are some positive signs on the other side. Q1 GDP was +2.0%. And consensus estimates – even with rising energy prices – are still placing it at roughly 1.5% for Q2. Q1 earnings have been remarkably strong at over 27% – the best since 2021 – and we’ve now had six consecutive quarters of double-digit earnings growth. Consumer spending remains elevated with same store sales rising 7.7% year-over-year. And the highest end of wage earners – those who drive discretionary spending – still have significant savings.
But falling real wages have been correlated with recessions in the past. The signal is worth taking seriously.
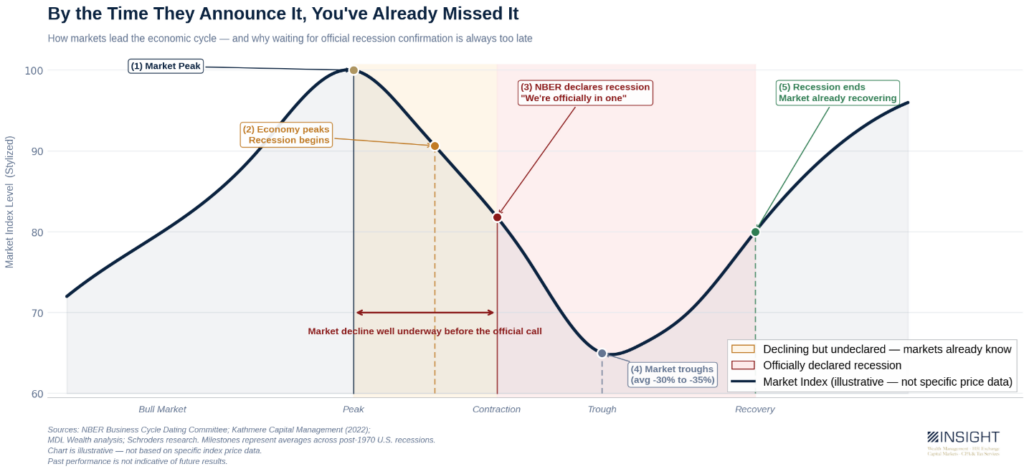
You’ve heard us talk in the past about how the worst markets – bear markets – are almost always linked to a recession. That’s true. But it’s not as easy as saying “A recession has been declared…time to sell everything!”
Why? Because the market consistently “declares” the recession well before it happens. The market has consistently peaked ahead of the official recession call. Sometimes by months. Sometimes by a year or more.
Past performance is not indicative of future results.
When you consider that the S&P 500, NASDAQ, and Russell 2000 closed at all-time highs on Friday (with the Dow just 1.37% below its peak), it’s worth wondering how close we are to the peak in the chart above.
In the end, the truth sits somewhere between Ro Khanna’s $5,000 per household energy inflation and Scott Bessent’s “all cylinders” optimism. A $1,400 per year burden is significant for a sizable portion of American households. And those households are already nervous about the future.
The market isn’t concerned…yet. And if the problems in the Strait are solved soon, the market can continue its focus on earnings growth as the consumer recovers. But hopes and dreams don’t protect lifetime savings. A recession is a real possibility, and several leading indicators are not pointing away from it.
And when that happens – during a declining market – the most common reaction amongst investors is going to be fear and panic. But the truth is quite the opposite. It should be jubilation. Because the NBER declaring the recession has been a strong signal that it will soon be time to take advantage of the dislocation. And our clients will be ready.
Sincerely,