
They say all good things must come to an end. Last week (and continuing this morning) we saw a significant hiccup in the “tech rally” that has driven markets higher over the last several months. We wanted to provide a bit of perspective about what this means for the market and your portfolio. As we have discussed many times over the last few weeks, we expect this fall to be a volatile period (given the election) and what happened in tech stocks last week might have been the start.
What Happened?
It is important to understand the dynamics of what happened last week before we dive into what it means for portfolios. And before we can understand what happened last week, we need to step back and get a feel for what has been happening over the last few months.
As you have heard from us for a while now, the “Big Tech” companies have been out over their skis for some time now. The FANMAGs (yes – we come up with silly acronyms all the time. This one means “Facebook, Amazon, Netflix, Microsoft, Apple and Google”.) have been driving market performance ever since the recovery began back in March. Those six names have grown so much over the last six months they now make up more than 25% of the entire S&P500. You heard that right – the other 494 companies in the S&P500 now make up less than 75% of the total index.
While that is an insane number, it has been good for the broader market over this period and for some of our portfolio holdings (more on that later). But when the other shoe drops, investors who have not been paying attention tend to get a bit skittish.
As you can see from the chart below, those six names were where most of the pain from last week was felt. We have added Tesla to the chart as well as, while it is not a member of the index, it also suffered greatly in the tech pullback. The chart tracks their performance from the close on Wednesday through the close on Friday.
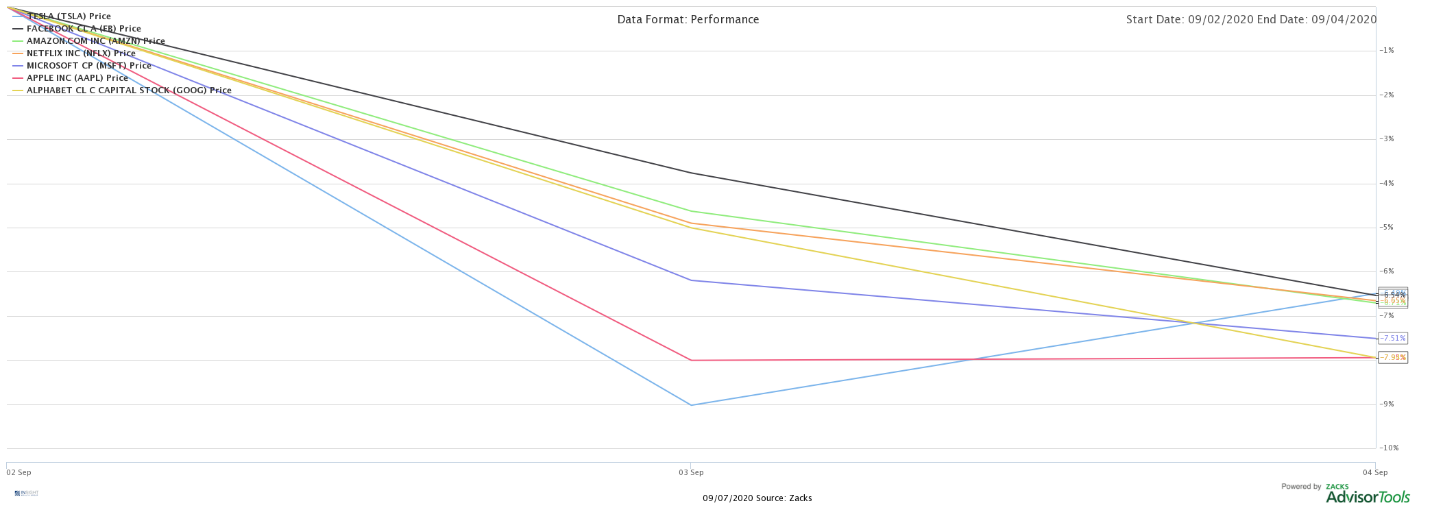
It is a little messy to read all the numbers on the right – as they are largely grouped together – but the group was down between 6.54% and 7.95% over the two-day period. The S&P500 during the same period was down 4.3% during the period and 2.09% for the week. Lord knows we have seen worse than a negative 2.09% week before – especially this year – so this is not a time to start panicking.
Perspective is Important
We mentioned the phrase “out over their skis” relative to the tech companies at the start of this memo. Let’s dive a bit more into what that actually means. Again, we are adding Tesla to this discussion as it is an important driver in this space even if it is not a member of the index.
We use price to earnings ratio as a measurement of value in these memos quite frequently. As you will recall us stating, a P/E of 18.5 is typically “fair value” in times of low interest rates such as we are seeing today. The forward P/E of the S&P 500 is currently 25.64. While that is pricey, you must remember just how much the FANMAGs are driving that figure up. Their current P/E is as follows (even after this week’s declines):
- Facebook (FB): 29.12
- Apple (AAPL): 30.62
- Netflix (NFLX): 64.16
- Microsoft (MSFT): 32.73
- Amazon (AMZN): 80.02
- Google (GOOG): 29.54
Given their weight in the index, these six names are bringing the forward P/E of the index up $10.10 per share. That is a shocking figure. But it does not even sound that crazy when you look at Tesla’s (TSLA) forward P/E. That comes in at a whopping 286.83x the forward 12-month earnings expectations!
To put the TSLA figure in a bit more of context, let’s compare them with other car companies. But let’s take the “tech name” shine out of it and break it down to the basics. The best way to do that is to look at price per sales (P/S). P/S is calculated by taking the companies market cap and dividing it by the sales over the last 12 months. Essentially this is saying how much per share in value did each dollar of sales make up.
Let’s look at P/S for a few automakers:
- Fiat Chrysler (FCAU): $0.18
- Ford (F): $0.21
- General Motors (GM): $0.37
GM is the big outlier here and drives the total up for the “Big Three”. Even so, let’s just average them out. They come in at $0.25/share.
Then let’s look at TSLA:
- Tesla (TSLA): $16.84
We certainly do not doubt the technological prowess of Elon Musk. Nor do we doubt there is an untapped well of innovation at TSLA. But in terms of pure value being driven to shareholders, the current valuation (and remember this is after a 6.49% drop in the last two trading days!) assumes 67.36X (i.e. 6,736%) more value per dollar of sales in TSLA. That means they would have to grow their sales by 6,736% (while not increasing share value at all) to fall in line with the Big 3.
Let’s stay on the sales topic for one more statistic and use Apple as the example. Year over year, Apple’s sales are up 5.7%. That is an astoundingly good number considering the pandemic. Tim Cook and team should be ecstatic. But over the same period, the share price of the company is up 160%!
Love these companies or not, you must admit they were starting to fly a bit too close to the sun.
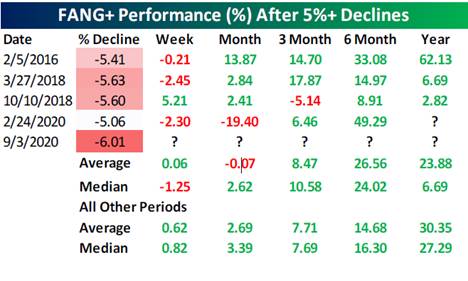
But it is also important to remember this is not the first time this has happened. The FANMAGs have been down more than 5% in a single day five times over the last five years. As you can see from the chart below, it certainly did not spell the end for these companies.
Past performance is not indicative of future results
Broader Market Perspective
Sometimes the market just needs to take a breather. As the saying goes, trees cannot grow to the sky. And neither can the market. That is why, on average, we see 3.3 five percent corrections each year. While this year has certainly been a bit spicier than most, a 5% correction in a single week is not uncommon – especially after all-time highs.
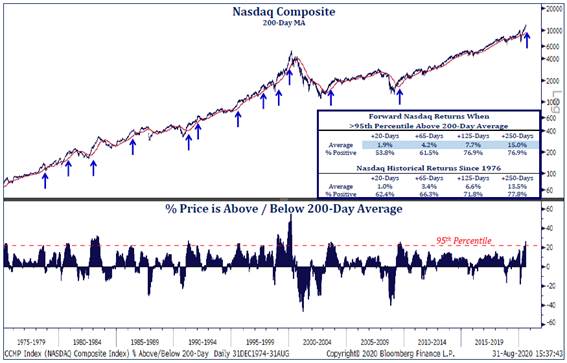
The NASDAQ was as extended as it has been since the Great Financial Crisis, which is not a surprise as it was up 19% for the quarter and 10% for August. As the chart below shows, it was approaching 30% above its 200-day average which is particularly uncommon (it has happened less than 5% of the time since 1975).
Past performance is not indicative of future results
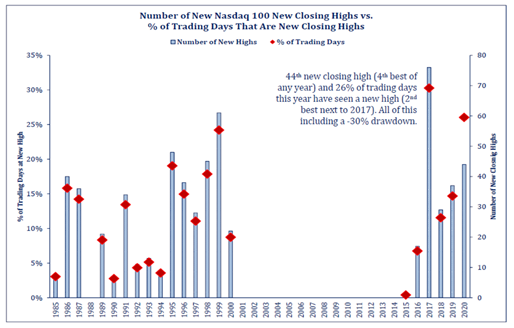
And nearly 26% of all trading days this year – even after the COVID correction – have been at all-time highs for the NASDAQ.
Past performance is not indicative of future results
When you combine that with the particularly light trading volume (this all happened in the two days before a holiday weekend) we saw this week, the results are not surprising.
The good news is this sell-off was unique to equities. As the chart below shows, credit spreads did not widen, nor did bond prices fall off, last week. That typically is a sign of profit taking in the equity markets and not a sign of broader market weakness.
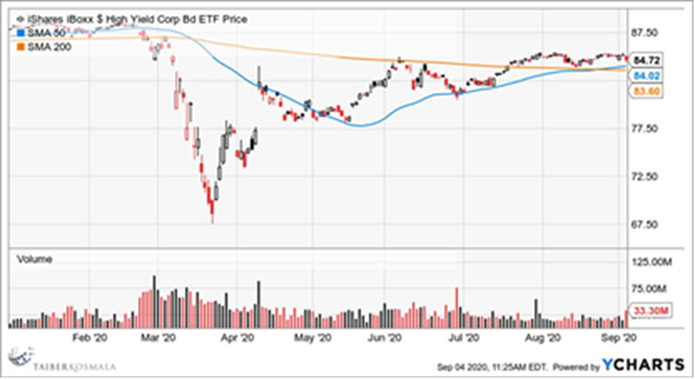
Past performance is not indicative of future results
Portfolio Positioning
We have gone on and on (and on and on…) for as long as we can remember in these memos about the importance of a balanced portfolio. For the last few months that has meant discussing why we are not heavy into tech stocks. Admittedly, if we had just loaded up the portfolio with the FANMAGs in March, we would probably be sitting on a beach somewhere instead of writing this memo! (And also trying to figure out how to get back from the beach since we would have had a very bad week…)
But life is not that easy, as this week has taught many. And money that comes easily goes just as quickly. That is why we believe in the hard work of constructing a portfolio that is made to last. This week it came in handy.
To put this in perspective, we have put together the chart below. It replicates the first chart from this memo (the FANMAGs + Tesla), but instead includes the top-10 holdings of our core portfolios. These holdings account for more than $80,000,000 of assets under our management.
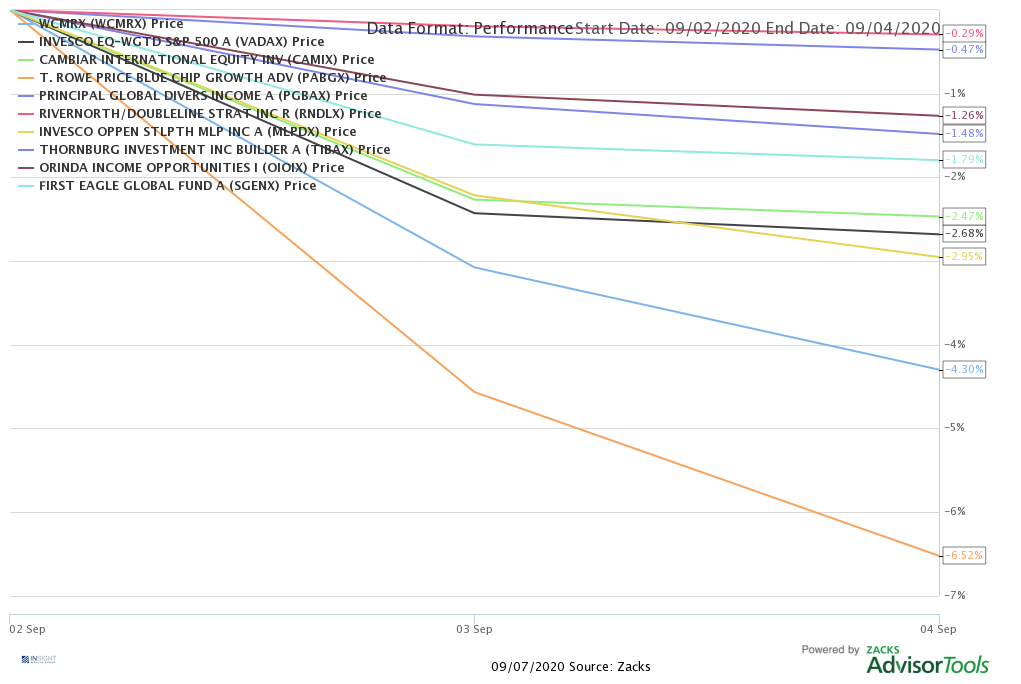
Past performance is not indicative of future results
As you can see, just one holding (PABGX) performed as poorly as the tech stocks. And only one other (WCMRX) underperformed the index. The weighted average of performance in these positions over the two-day period was -2.52%. Much better than the markets -4.30%. We would also point out that PABGX – one of our positions that has substantial exposure to the FANMAGs – is still up 25.64% YTD.
This year will undoubtedly throw many more curveballs our way (hello Election Season!), but a little profit taking in tech is not the worst thing we have seen – either for your portfolios or for the market itself.
Sincerely,