
The Weekly Insight: Can 2026 Continue the Trend?
Happy Holidays! It’s shocking to realize that 2025 is almost behind us. We suppose they’re right when it’s said that the years fly by more quickly as you age!
Barring whatever may happen in the next 9 days, 2025 was a tremendous year for the market and portfolios. But it was also one filled with drama and unknowns for investors. As one client put it quite well a few months ago: “I’ve never known a year where everything went so well and felt so uneasy.”
We told you in last week’s memo that the big banks and institutions are remarkably bullish on 2026. The average target for the S&P 500 – amongst thirteen of the largest institutions – was 7,588. That is over 11% higher than the market closed last Friday.
That’s a remarkable assumption when you consider this fact: barring a complete collapse of the markets in the next two weeks, this will be just the sixth time since 1930 when we’ve had double-digit returns in the S&P 500 for three consecutive years. If the prognosticators are correct – and we get a fourth consecutive year – that would be just the fourth time ever. It only happened at the end of WWII, in the early 1950s, and at the end of the 1990s.
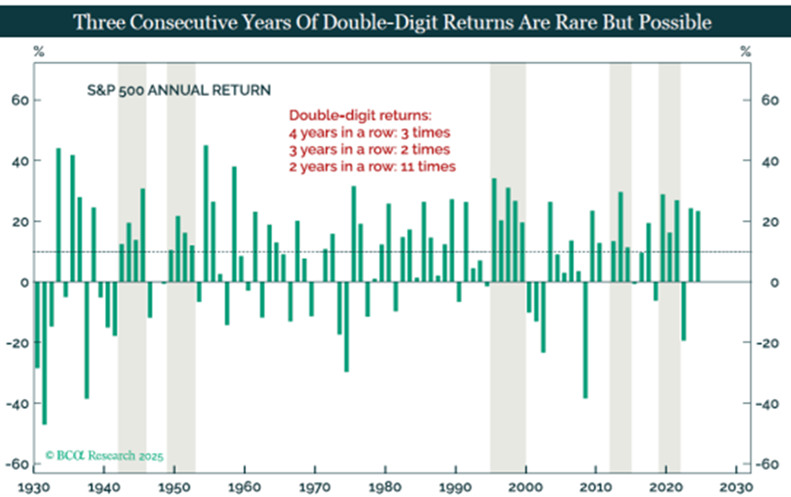
Source: BCA Research
Past performance is not indicative of future results.
You know by now we’re not big fans of the “this time it’s different” argument. History has a strong pull on markets. As they say, it may not repeat itself, but it often rhymes. Why? There’s not much we experience that hasn’t been experienced before. Is AI new? Of course. But we’ve been through technological revolutions before. What happened before can serve as a guide. So, yes, a fourth year of double-digit returns is rare and potentially unlikely.
But that’s one historical comparable. There are others that lend themselves more toward the outcome analysts are predicting. Let’s look at a few and how they might guide us our decision making in 2026.
As Bull Runs Mature, Participation Broadens
You’ve heard us discuss this before: the market rally we’ve experienced over the last few years has been very, very narrow. It’s been dominated by the top names in the market – largely AI-driven names – and has caused the S&P to become increasingly top-heavy.
We’ve shared this chart before showing the market is the most concentrated we’ve ever seen.
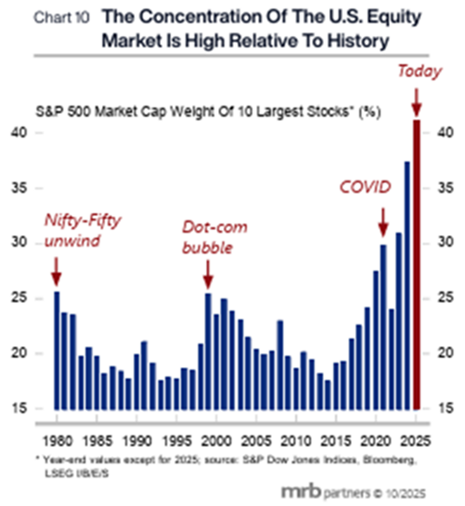
Past performance is not indicative of future results.
That data is from the end of October and shows that the top ten names in the S&P made up over 42% of the index. Just fifty days later, we’re starting to see a shift. As of the close of the market on Friday, the same names now made up 38.89% of the index. It’s not a huge shift (it would still be the most concentrated market in history!), but it’s notable.
And it’s happening because we’ve seen a meaningful change in what the market is supporting since November 1st. In the month of November, non-Magnificent 7 stocks outperformed the Magnificent 7 by nearly 300 basis points.
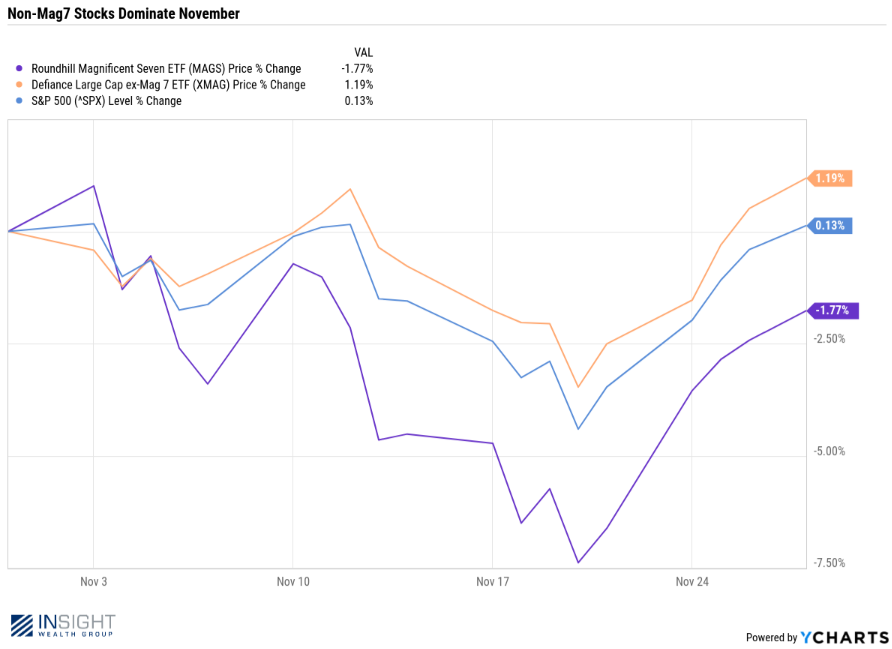
Past performance is not indicative of future results.
Historically, bull markets often begin with narrow leadership and broaden as confidence improves and financial conditions ease. That broadening has typically coincided with falling rate volatility and improving earnings visibility.
It seems that trend has gotten a boost in the last fifty days. Will it continue? We’ll be watching that closely. Breadth expansion of the bull market is common – but it’s not guaranteed.
Easing Financial Conditions
As you all know by now, the Fed gave us another rate cut two weeks ago. It was not unexpected. But it also wasn’t the biggest story out of the Fed meeting. The biggest story was the level of disagreement Fed members had about where rates should go in the future. The “dot plot” was the most dispersed – especially over the long-run – that we’ve ever seen. Simply put, the Fed left a lot of uncertainty out there for the market.
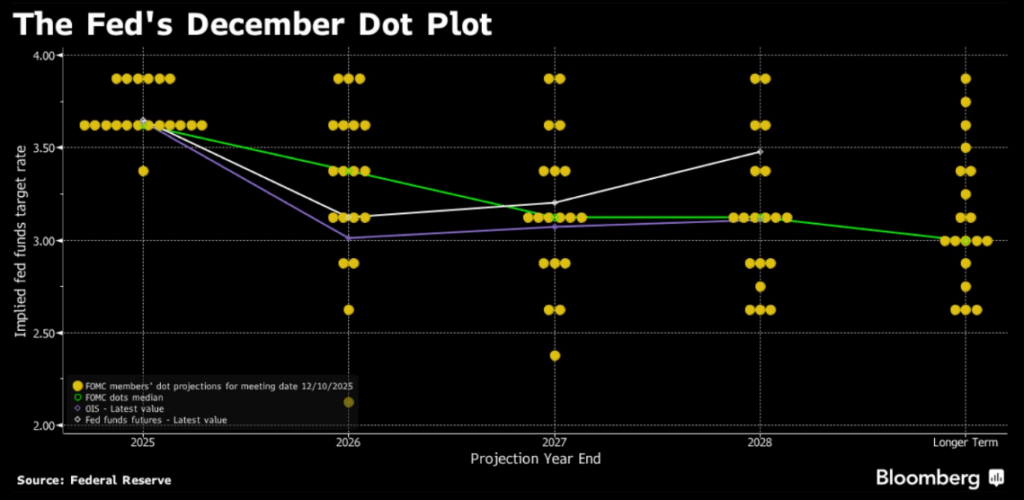
Past performance is not indicative of future results.
We all know how much the markets love uncertainty. If rate cuts were all that mattered to financial conditions, this would be a negative chart for the market.
The first thing to note is that every bear market since the 1970s has been tied not to disagreement on rate cuts – but instead to rate increases coming out of the Fed. There is absolutely zero indication the Fed will be raising rates any time soon.
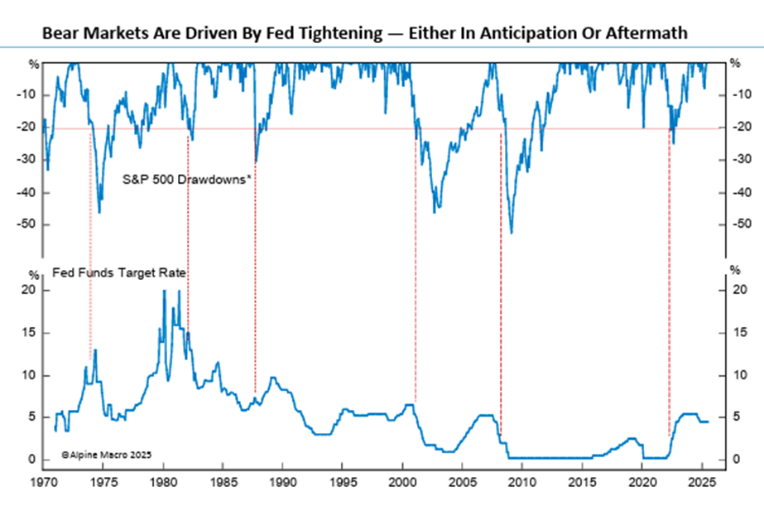
Past performance is not indicative of future results.
But the Fed isn’t the only thing that creates liquidity for the economy. And growing liquidity – as we noted above – is particularly good for the expansion of market growth. That liquidity is showing up in bank lending, corporate bond issuance, and money market assets. There is no sign of liquidity falling off any time soon.
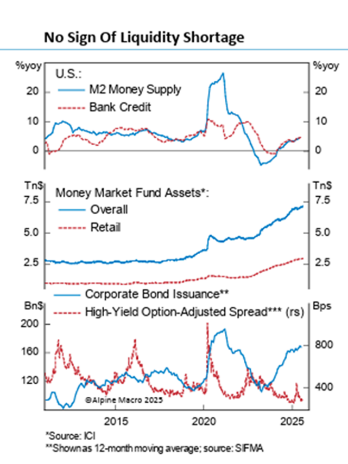
Past performance is not indicative of future results.
There is one other governmental institution that creates liquidity for the economy: Congress and the White House. And the fiscal stimulus from Washington – driven by the One Big Beautiful Bill – will be peaking throughout the first half of 2026. Throughout the year it will result in two full percentage points of GDP.
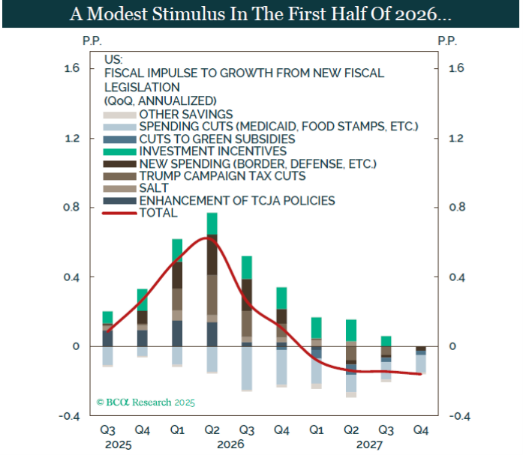
Past performance is not indicative of future results.
And, on top of that, taxpayers are anticipated to get an extra ~$160 billion in tax refunds in 2026.

Source: Strategas
Past performance is not indicative of future results.
Simply put, the spigot is turned on in Washington. We can debate how sustainable that will be in the years to come. But for 2026? It’s a good sign for short-term market outcomes.
In the end, you’re all smart enough to know bull markets don’t go on forever. And the ending of them isn’t the end of the world. But as of this moment, there isn’t significant reason to be fundamentally concerned about 2026. It may indeed be another good year.
Sincerely,