
Insight Wealth Group Podcast – What’s the Bond Market Telling Us?
We hope this week’s memo finds you well rested after the Labor Day holiday. It’s hard to believe we’re already jumping into the last few months of the year.
If last week’s market moves were any indication of what we’ll see between now and 2027, we’re likely in for a bit of drama! And that shouldn’t be much of a surprise. The Iran conflict continues to dominate the news (see the market impact last Monday and Tuesday), the market remains on pins and needles about potential rate hikes (see the market impact on Wednesday and Thursday), and we have a little thing called a mid-term election coming up in just eight weeks.
All will impact the market in the coming weeks. All have the potential to cause pain in the markets. All will certainly create headlines in the media.
But there is a stark difference between “headlines” and “results.” Last week proved that point. Despite all the news about Iran, “surging” treasury yields, and potential rate hikes…nothing really happened. The S&P 500 ended the week up 0.09%, 10-year Treasury yields rose 0.04%, and the VIX fell over 1.5%. Drama did NOT equal outcomes.
But there is a story forming out there right now that is important to understand. And it’s the story of the bond market today.
The bond market gets largely ignored in the press. Yes, there are stories about “yields rising.” But they’re not as sexy – or as click-generating – as the story about a stock breaking out or collapsing.
But the bond market matters. Perhaps more than equities in the grand scheme of things. As famed economist Ed Yardeni once wrote:
“If the fiscal and monetary authorities won’t regulate the economy, the bond investors will.”
The global bond market is larger than the global equities markets. But not for retail investors. They own a very small slice of it (just 15% per SIFMA). Institutions own the vast majority. The supposed “smart money.”
In fact, institutions have historically owned more bonds than equities. Are retail investors missing out? Maybe yes, maybe no. But when bonds start to become the story – and you don’t understand the story – that’s a major disadvantage.
Bonds As an Indicator
The story that always seems to pop in times like these is the “bond market is an indicator.” But an indicator of what? The future of the equity markets? The future of the economy? In one way or another, the answer to those questions somehow always comes back to “yes.”
But there are no perfect indicators. Regular readers know we think a lot about recessions. Understanding when a recession is coming can tell you a lot about investment allocation.
But predicting a recession is no easy job. Market researchers and economic analysts have tried for years to devise the perfect metric – the unassailable way to understand when economic trouble is coming.
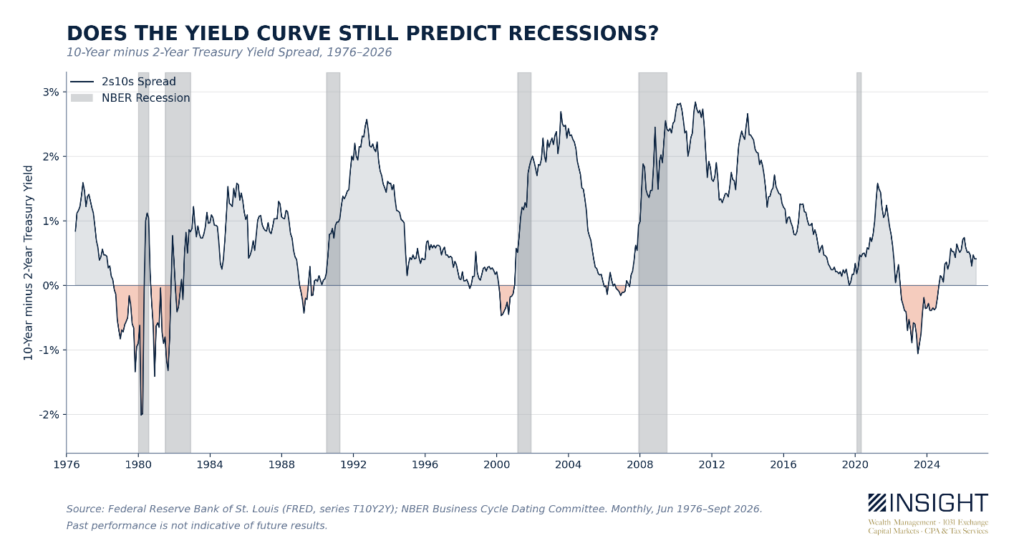
Until recently, the market thought this problem was solved via a simple understanding of bond yields. For the last 50 years, an inversion of the spread between 10-year Treasuries and 2-year Treasuries (meaning 2-years were paying more than 10-years) had been a near perfect predictor of a recession. It worked in the late 1970s, the 1980s, 1990s, 2000s. Heck, it almost predicted the “COVID Recession” (which we would argue wasn’t so much a recession, but a government mandated economic shut down).
Except it triggered again in 2022 and here we are – four years later – with no recession to show for it.
Another great indicator of risk in the economy – if not a recessionary predictor – is the High Yield Spread. This measures the yield on a basket of high-yield (HY) bonds (i.e., junk bonds) vs. a basket of treasuries. If you think about it, HY bonds should demand more interest because they are substantially riskier than Treasuries. And – if you believe the risk to the economy is going up – those bonds would be the first to default, right? So, the greater the risk to the economy, the higher the high-yield spread should be.
Today? It’s at one of its lowest points recorded in the last 20 years – more than 2.5% below its 25-year average. Even if you remove the spike that happened in 2008, it’s still 2.14% below average.
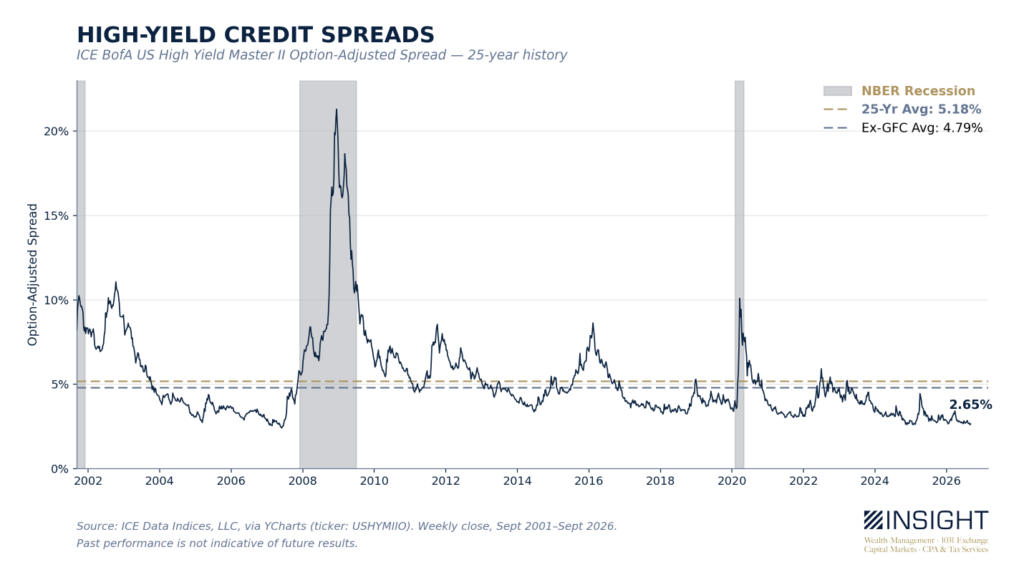
So, by the traditional methods of interpreting the bond market, crisis is not just around the corner.
What’s Everyone Worried About?
One thing that is undeniable is this: Treasury yields are rising. The reasons are many and complex. The Fed no longer cutting has released pressure to the high side – and the rising concern about rate hikes isn’t helping. Inflation hasn’t abated as much as many would hope. The Iran war oil shock added to that concern. The Treasury is issuing more debt, but buyers are more hesitant to buy it.
In the end it’s the constant truth of the bond market: yields will move until they reach a level that creates a demand.
But that also creates another interesting point: at what level will the bond yield reduce investors’ appetite for equities? How high will a “risk-free” yield (that’s still what Treasuries are generally considered) need to go before people start saying “I’d rather park my money there.” That’s the moment equity markets are concerned about.
Which brings us to one more “yield spread”: the spread between the 10-year Treasury and the Effective Federal Funds Rate (the rate the Federal Reserve sets). Right now, that spread is expanding as Treasury yields rise and the Fed rates remain the same. Bond traders say that the curve is “steepening.”
There are two types of steepening that exist for this curve: “bull” and “bear.” But they aren’t the “bull” and “bear” you think of when you think of equities. Bull markets exist in bonds when yields (or spreads in this case) are falling. Why? Because if I own a bond making 4% yield and the yield drops to 3.5%, my bond is suddenly more valuable. But if yields jump to 4.5%, my bond is worth less because an investor can buy more yield elsewhere.
So, a bull steepening in this spread happens when the Feds rate is falling faster than the 10-year Treasury yield. That’s not happening today. Fed rates are steady. Instead, the 10-year yield is rising. And so, we find ourselves today amid a bear steepening.
That doesn’t mean a lot to the general public. But it gets us going back to the data to understand exactly how a bear steepening has impacted public markets in the past. This is the ninth bear steepening since 1966. So far, it’s one of the longest on record (having officially started last September). And it turns out our market results are in line with past experiences.
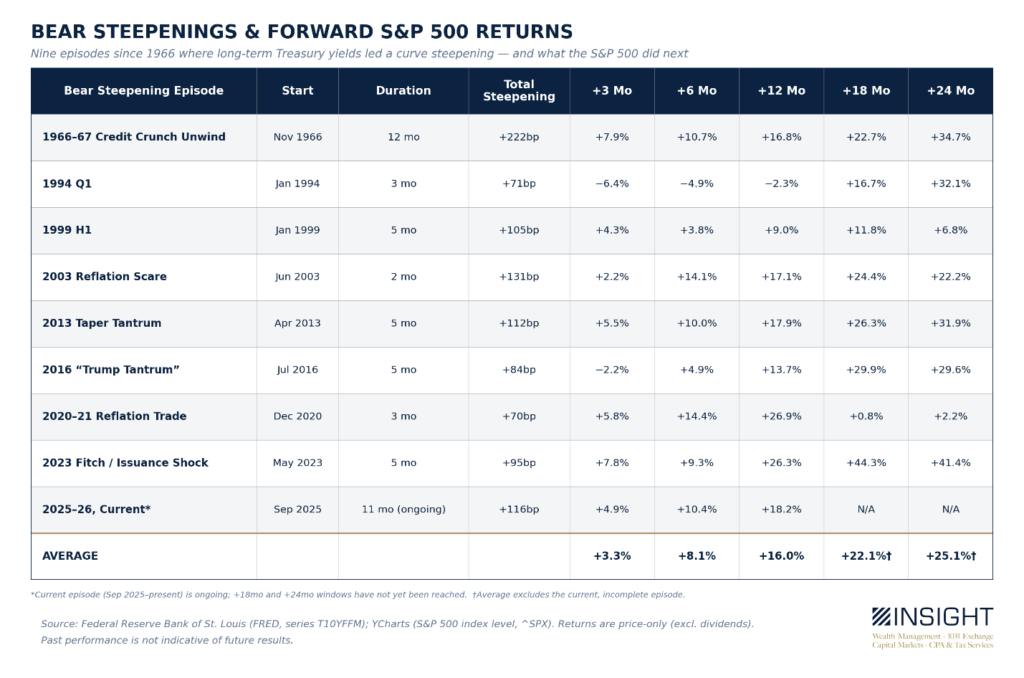
Does this guarantee a great next six months for us – presuming we keep pace with the historical precedent? Of course not. But it does tell us this moment is not outside the bounds of what we’ve seen before.
What Does All of This REALLY Mean
So what have we actually learned?
- The previous gold standard of recession indicators isn’t working in this environment (or at least hasn’t worked yet)
- High-yield traders see this as one of the least risky environments in history.
- Treasury traders disagree and are pricing in rising risk, pushing 10-year Treasuries higher.
None of this is particularly important news. Especially the disagreement between high-yield traders and treasury traders. In fact, we’ve seen this several times in the last 20 years. And in 2013, 2016, 2020, and 2023 it resulted in…nothing. It was a false alarm.
But the time before that? The time before that was a catastrophe. It started on June 1, 2007. The tightest high-yield spread in history at 2.41%. And the result was the Great Financial Crisis of 2008 – 2009.
Is this a warning for that? Nope. But it is worth watching.
From June 1st, 2007, to August 31st, 2007, the High Yield Spread went up 88%. The S&P was off a bit more than 4%, and Treasury yields were off a bit more than 8%. That should have been a warning for investors. But it wasn’t.
By the end of 2007, the story was still the same for stocks, with the S&P off 4.42%. But the High Yield spread was now up 142%.
It wasn’t until September 9th, 2008 – over 15 months later – that the S&P finally closed down 20% from its June 1st level. By then high yield spreads were up 253.9%.
THAT is a signal. Or at least it should have been. So, if we start to see a blowout in high yield spreads? Expect us not to wait 15 months.
But in the meantime? This hasn’t proven a crisis yet. But it may soon be an opportunity to add duration to our bond portfolios as Treasuries continue to creep up. Adding some additional risk-free yield has historically been a good trade.
Sincerely,